


 16 May 2013
2013- n° 113In April 2013, further decline in oil prices Prices of oil and raw material imports - April 2013
16 May 2013
2013- n° 113In April 2013, further decline in oil prices Prices of oil and raw material imports - April 2013
In April, the crude oil price in euro terms decreased once again (-5.9% after -2.9% in March), reaching € 79.7 per barrel of Brent. Prices of commodities except energy imported into France also fell more sharply in April than in March (-3.9% after -0.2%).
In April, the crude oil price in euro terms decreased once again (-5.9% after -2.9% in March), reaching € 79.7 per barrel of Brent. Prices of commodities except energy imported into France also fell more sharply in April than in March (-3.9% after -0.2%).
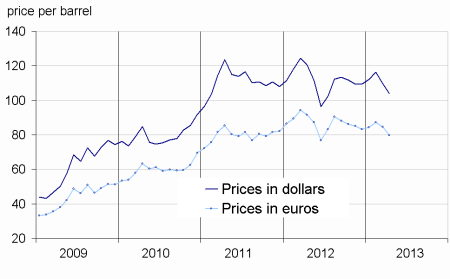
Oil prices fell again
In April, the price of crude oil from the North Sea (Brent) in dollars terms continued to decline (-5.3% after -5.8%). It stood at $103.8 per barrel. In euros terms, the price of Brent fell slightly more strongly (-5.9% after -2.9%), due to an appreciation of the euro against the dollar (+0.6%).
The prices of imported industrial raw material declined
In April, prices of industrial raw materials in euro terms declined again (-4.7% after -2.1%). In particular, prices of mineral raw materials fell sharply (-5.0% after -3.8%). Prices of non-ferrous metals dipped strongly (-5.3% after –3.3%), due to a fall in prices of aluminum (–3.5%), zinc (–4.6%), copper (–6.5%), nickel (–7.1%) and lead (-7.6%). Prices of precious metals also declined more sharply (–8.9% in April after –0.5% in March). This decrease affected mainly the prices of silver (-13.0%) and gold (-7.3%) whose safe haven status has faded. The prices of platinum (-6.5%) and palladium (-7.7%) also slumped significantly, in particular because of the weakness of the European automobile market. The price of iron ore also fell in April, but less sharply than in March (–2.3% after -6.8%).
On the other hand, prices of agro-industrial raw materials declined (-3.8% after +3.4%). In particular, the prices of sawn softwood (-5.9%) and natural rubber (-11.4%) decreased significantly. In addition, the prices of natural textile fibers bended (-3.1% after +7.5%), due to the fall in cotton prices (-2.4% after +8.5%).
The raw food materials prices receded
In April, prices of raw food materials in euro terms receded (-2.6% after +3.2%). Thus, prices of oilseeds folded (-3.2% after +1.5%) and notably those of soybean (-3.6%) and soybean meal (-4.1%), due to the weakness of the Chinese demand.
Meanwhile, prices of cereals diminished significantly (-5.8% after +3.1%), notably due to a fall in corn prices (-11.4%). Prices of sugar also decreased (-3.8%). Similarly, prices of beef fell sharply (-4.0%). However, prices of tropical foodstuff rose again (+1.0% after +1.4%), due to the sharp rise in the price of cocoa (+5.9%).
tableautabpetrole – Oil and petroleum products
| Prices | Change (%) | |||
|---|---|---|---|---|
| Over the last month | Over the last month | Over the last 3 months | Over the last 12 months | |
| Brent in $ per barrel | 103.8 | –5.3 | –7.4 | –13.9 |
| Brent in € per barrel | 79.7 | –5.9 | –5.4 | –13.1 |
| Gasoline €/L | 0.55 | –6.5 | –2.7 | –14.2 |
| Gas Oil | 663.8 | –5.9 | –7.9 | –13.0 |
| Heavy fuel | 453.3 | –5.4 | –5.3 | –19.5 |
| Naphtha | 629.3 | –10.3 | –10.2 | –20.0 |
- Prices are in euros per ton unless otherwise specified
- Source: INSEE
tableautabmatprem – Imported raw materials (excluding energy) in euros
| Index | Changes (%) | |||
|---|---|---|---|---|
| Over the last month | Over the last 3 months | Over the last 12 months | ||
| Food total | 184.7 | –2.6 | –0.1 | –0.9 |
| Tropical foodstuff | 146.9 | 1.0 | –0.8 | –6.4 |
| Oil seeds, vegetable oils | 234.6 | –3.2 | –0.2 | 3.9 |
| Cereals | 203.9 | –5.8 | –3.7 | –2.0 |
| Sugar | 152.2 | –3.8 | –3.3 | –22.2 |
| Beef meat | 120.6 | –4.0 | 3.5 | 3.3 |
| Industrial raw materials | 170.4 | –4.7 | –6.3 | –6.5 |
| Agricultural raw materials | 110.5 | –3.8 | –0.6 | 2.9 |
| Natural Fibers | 134.2 | –3.1 | 8.2 | –7.1 |
| Natural rubber | 272.0 | –11.4 | –16.2 | –31.0 |
| Hides | 88.2 | 4.6 | 7.9 | 19.8 |
| Wood pulp | 87.7 | 0.4 | 3.9 | 1.2 |
| Tropical wood | 97.9 | 0.9 | –2.2 | –6.0 |
| Sawn softwood | 105.7 | –5.9 | 1.8 | 37.3 |
| Minerals | 203.1 | –5.0 | –8.0 | –9.3 |
| Iron ore | 780.7 | –2.3 | –6.8 | –6.0 |
| Non-ferrous metals | 151.3 | –5.3 | –8.0 | –10.2 |
| Precious metals | 266.5 | –8.9 | –11.0 | –10.8 |
| All commodities | 168.8 | –3.9 | –4.1 | –4.5 |
- Source: INSEE
graphiqueG_petrole_ang – Oil
- Source: INSEE
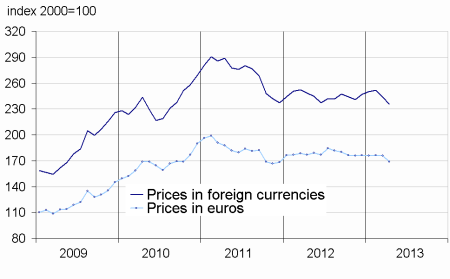
graphiqueG_alim_ang – Food
- Source: INSEE
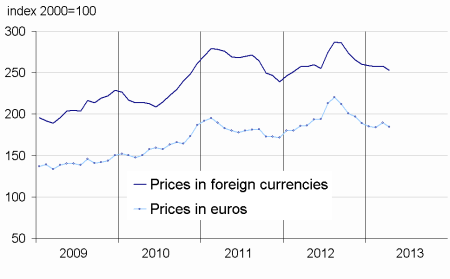
graphiqueG_ensemble_ang – All commodities
- Source: INSEE
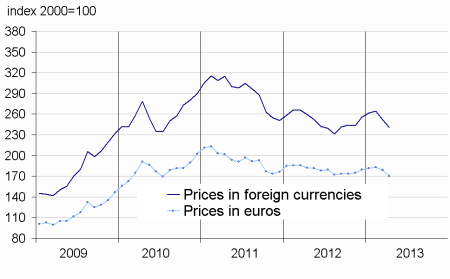
graphiqueG_indus_ang – Industrial raw materials
- Source: INSEE
Pour en savoir plus
Time series : Raw materials prices
