


 31 January 2012
2012- n° 32In December, households’ consumption in goods decreased (–0.7%) Household consumption expenditure on goods - December 2011
31 January 2012
2012- n° 32In December, households’ consumption in goods decreased (–0.7%) Household consumption expenditure on goods - December 2011
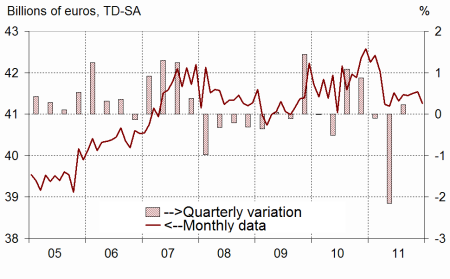
In December, households’ expenditure in goods decreased by 0.7% in volume*, after having increased by 0.1% in November. This decrease is mainly imputable to that of food and energy products. Over the fourth quarter, consumption in goods remained stable, after +0.2% in Q3.
In December, households’ expenditure in goods decreased by 0.7% in volume*, after having increased by 0.1% in November. This decrease is mainly imputable to that of food and energy products. Over the fourth quarter, consumption in goods remained stable, after +0.2% in Q3.
[* Volumes are chained and all figures are trading days and seasonally adjusted.]
Engineered goods : slightly increasing
Durables : car purchases increasing
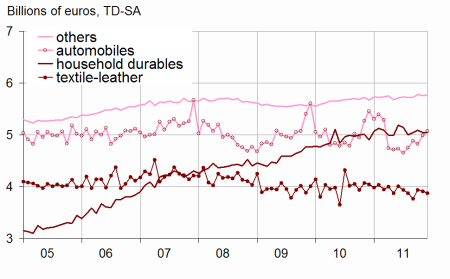
Households’ expenditure in durables increased anew in December (+0.8%, +1.5% in November). Over the quarter, they increased by 2.1%, after +0.6% in Q3. The monthly evolutions are explained in particular by car purchases renewed increase (+1.6% in Decembe, after +3.6% in November). Over the quarter car purchases accelerated : +4.2% after +0.7% in Q3 ; expenditure in household durablesheld steady (after +0.1% in Q3).
Textile-leather : decreasing
Purchases in textile and leather decreased in December (–0.9%, after –0.7% in November). Nevertheless, due to a rebound in October, they increased over the quarter by 1.2%, after -2.6% in Q3.
Other engineered goods : slightly increasing
Consumption expenditure in other engineered goods slightly increased in December (+0.2%, after –0.4% in November). Over the quarter, it increased by 0.7% (after +0.2% in Q3).
graphiquegraph1_new_ang – Total consumption of goods
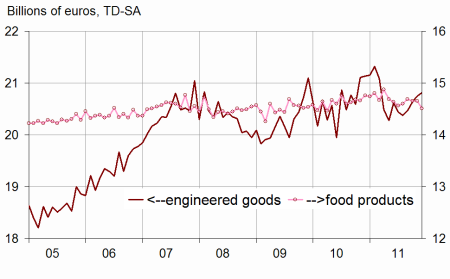
graphiquegraph2_new_ang – Food and engineered goods
graphiquegraph3_new_ang – Decomposition of engineered goods
Food products : less purchases for holiday period
Consumption in food products decreased in December by 1.0%, after helding steady in November. Over the quarter, these expenditure were almost stable (-0.1% after -0.8% in Q3)
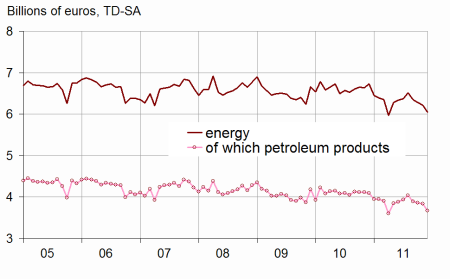
Energy : new step back in December
Consumption in energy products decreased anew in December (-2.7%, after -0.9% in November), in particular due to a marked fall in heating oil purchases under mild weather conditions. Over the quarter, expenditure in energy stepped back by 3.6% after having increase by 3.5% the previous quarter.
The evolution of household consumption in goods in November is scaled up by 0.2 point.
The increase of household consumption in goods is now estimated at +0.1% in November, instead of a –0.1% estimated the previous month.
This revision is notably due to the integration of new information concerning expenditure in health products, as well as the revision of seasonality.
tableauenglish_trim – Households consumption expenditures in manufactured goods
| Oct. | Nov. | Déc. | Déc.11/ | Q4 11/ | |
|---|---|---|---|---|---|
| 2011 | 2011 | 2011 | Déc.10 | Q3 11/ | |
| Food products | 14.648 | 14.654 | 14.512 | ||
| Change (%) | –0.3 | 0.0 | –1.0 | –1.7 | –0.1 |
| Engineered goods | 20.647 | 20.750 | 20.808 | ||
| change (%) | 0.9 | 0.5 | 0.3 | –1.6 | 1.5 |
| Of which: | |||||
| Automobiles | 4.822 | 4.995 | 5.075 | ||
| Change (%) | –1.3 | 3.6 | 1.6 | –7.0 | 4.2 |
| Household durables | 5.090 | 5.045 | 5.046 | ||
| Change (%) | 0.8 | –0.9 | 0.0 | 3.0 | 0.0 |
| Textile-leather | 3.940 | 3.913 | 3.877 | ||
| Change (%) | 4.5 | –0.7 | –0.9 | –4.1 | 1.2 |
| Other engineered goods | 5.781 | 5.756 | 5.769 | ||
| Change (%) | 0.9 | –0.4 | 0.2 | 1.7 | 0.7 |
| Energy | 6.3 | 6.2 | 6.0 | ||
| Change (%) | –1.2 | –0.9 | –2.7 | –10.1 | –3.6 |
| Including petroleum products | 3.9 | 3.8 | 3.7 | ||
| Change (%) | –0.9 | –0.6 | –4.2 | –10.2 | –4.3 |
| Total | 41.500 | 41.538 | 41.253 | ||
| Change (%) | 0.1 | 0.1 | –0.7 | –3.1 | 0.0 |
| Manufactured goods | 36.160 | 36.226 | 35.982 | ||
| Change (%) | 0.3 | 0.2 | –0.7 | –2.4 | 0.4 |
graphiquegraph4_new_ang – Energy
Documentation
Methodology (pdf,23 Ko)
Pour en savoir plus
