


 13 July 2012
2012- n° 176In June 2012, the prices of imported raw materials registered a further decline Prices of oil and raw material imports - June 2012
13 July 2012
2012- n° 176In June 2012, the prices of imported raw materials registered a further decline Prices of oil and raw material imports - June 2012
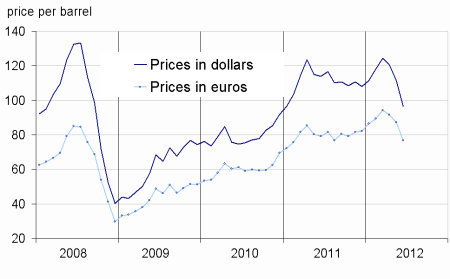
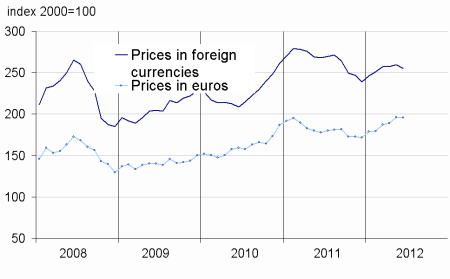
In June, the price of oil in dollars continued to decline (–13.5% after –7.6%) in May). It stood at $96.4 per barrel Brent, its lowest level since January 2011. Meanwhile, the foreign currency prices for non-energy commodities imported into France recorded a further decline (-3.2% after –1.6% in May).
In June, the price of oil in dollars continued to decline (–13.5% after –7.6%) in May). It stood at $96.4 per barrel Brent, its lowest level since January 2011. Meanwhile, the foreign currency prices for non-energy commodities imported into France recorded a further decline (-3.2% after –1.6% in May).
The oil prices continued to decreased
In June, the decline in the dollar price of oil from the North Sea (Brent) has increased significantly (-13.5% after -7.6%). In euros, the decline in oil prices was also marked (-11.8% after –4.9 %), despite a further depreciation of the euro against the dollar (-2.0%).
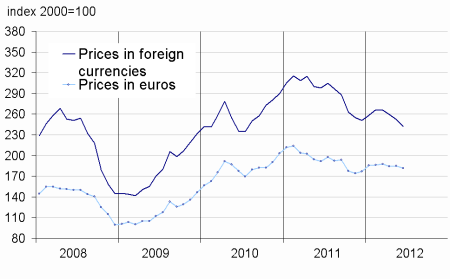
The prices of industrial raw material still down
In June, the prices of industrial raw materials in foreign currencies continued to fall (-4.0% after -3.0% in May). The decline in the prices of mineral raw materials has continued to increase (-4.1% after -4.4%). In Particular, the prices of nonferrous metals fell sharply (-5.3% after –3.3%), notably those of copper (-6.3%), aluminium (-5.8%) and lead (-7.2%). However, the decline in the prices of precious metals has significantly attenuated (-0.6% after –6.3%). The price of silver fell less sharply than in May (-2.2% after -9.1%) and those of gold rose again (+0.7% after –3.9%).
The prices of agro-industrial raw materials retreated (-3.6% after +1.2%), especially those of natural rubber (-12.8%) and natural textile fibers (-6.5%) and as the cotton (-7.0%).
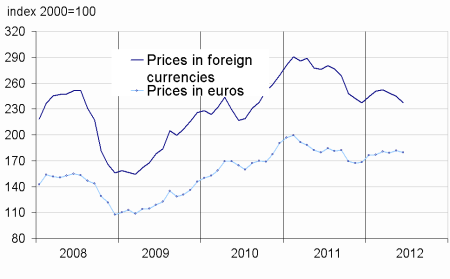
The prices of raw food materials retreated
In June, the prices of raw food materials in foreign currencies decreased (-1.8% after +0.9% in Mayl). Indeed, the tropical foodstuffs prices fell (-4.1% after +0.9%), due to the sharp drop in the price of arabica (-9.7%) and to a lesser extent than those of cocoa (-3.2%). The prices of oilseeds have also declined (-0.4% after +1.3%), including those of
palm oil (-10.3%) and olive oil (-3.3%), as well as those of the cereals (-1.4% after +2.2%), due to a further decrease in the price of corn (-2.2%). The prices of sugar were however on the rise again (+1.0% after –11.9%).
tableautabpetrole_ang – Oil and petroleum products
| Prices | Change (%) | |||
|---|---|---|---|---|
| of last month | over the last month | over the last 3 months | over the last 12 months | |
| Brent in $ per barrel | 96,4 | –13,5 | –22,6 | –15,4 |
| Brent in € per barrel | 76,9 | –11,8 | –18,4 | –2,8 |
| Gasoline | 929,1 | –9,0 | –19,7 | –7,8 |
| Gas Oil | 843,3 | –9,7 | –17,7 | –10,5 |
| Heavy fuel | 553,6 | –11,7 | –20,5 | –9,0 |
| Naphtha | 731,9 | –17,0 | –31,4 | –22,0 |
- Prices are in dollars per tonne unless otherwise specified
- Source : INSEE
tableautabmatprem – Imported raw materials (excluding energy) in domestic currency
| Index | Changes (%) | |||
|---|---|---|---|---|
| over the last month | over the last 3 months | over the last 12 months | ||
| Food total | 255,1 | –1,8 | –0,9 | –4,8 |
| Tropical foodstuff | 216,3 | –4,1 | –6,7 | –24,7 |
| Oil seeds, vegetable oils | 312,7 | –0,4 | 6,8 | 8,1 |
| Cereals | 298,4 | –1,4 | 0,9 | 3,1 |
| Sugar | 251,0 | 1,0 | –17,3 | –21,6 |
| Beef meat | 167,0 | –2,1 | –4,0 | 6,9 |
| Industrial raw materials | 242,0 | –4,0 | –8,8 | –18,8 |
| Agricultural raw materials | 144,6 | –3,6 | –2,6 | –10,7 |
| Natural Fibers | 172,3 | –6,5 | –17,0 | –43,5 |
| Natural rubber | 369,4 | –12,8 | –19,8 | –33,6 |
| Hides | 105,4 | –1,7 | 1,1 | –2,2 |
| Wood pulp | 124,9 | –0,1 | 1,0 | –15,4 |
| Tropical wood | 142,6 | –3,3 | –2,7 | –11,0 |
| Sawn softwood | 116,5 | –1,8 | 7,0 | 29,2 |
| Minerals | 294,0 | –4,1 | –10,8 | –21,4 |
| Iron ore | 1081,3 | –1,2 | –6,9 | –21,2 |
| Non-ferrous metals | 220,7 | –5,3 | –12,0 | –22,7 |
| Precious metals | 398,2 | –0,6 | –9,6 | –10,1 |
| All commodities | 236,9 | –3,2 | –6,0 | –14,1 |
- Source : INSEE
graphiqueG_petrole_ang – Oil
- Source : INSEE
graphiqueG_alim_ang – Food
- Source : INSEE
graphiqueG_ensemble_ang – All commodities
- Source : INSEE
graphiqueG_indus_ang – Industrial raw materials
- Source : INSEE
Pour en savoir plus
Time series : Raw materials prices
