


 10 January 2012
2012- n° 13In December 2011, the prices of the imported commodities recordered a further decline Prices of oil and raw material imports - Decembre 2011
10 January 2012
2012- n° 13In December 2011, the prices of the imported commodities recordered a further decline Prices of oil and raw material imports - Decembre 2011
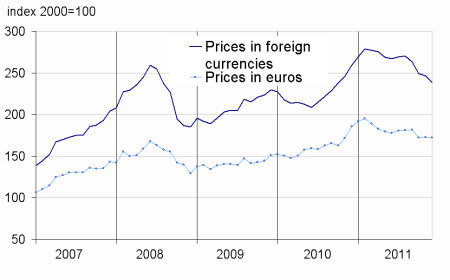
In December, the price of oil in dollars fell(-2.4 % after +2.1% in November). It stood at $108.1 per barrel Brent. Meanwhile, the foreign currency prices for non-energy commodities imported into France recordered a further decline (-1.9% after -1.5%). Year-on-year, they edged down by 11.3 %, after increasing by nearly 20% in 2010.
In December, the price of oil in dollars fell (-2.4 % after +2.1% in November). It stood at $108.1 per barrel Brent. Meanwhile, the foreign currency prices for non-energy commodities imported into France recordered a further decline (-1.9% after -1.5%). Year-on-year, they edged down by 11.3 %, after increasing by nearly 20% in 2010.
The prices of oil in dollars folded
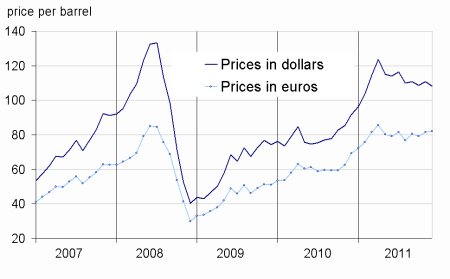
In December, the dollar price of oil from the North Sea (Brent) fell (-2.4% after +2.1%). However, in euros, oil prices rose slightly (+0.6 % after +3.3 % in November), due to the depreciation of European currency against the dollar (-3.0%). Over the year, the price of barrel of Brent increased by 17.8% in $ and by 18.4% in €.
Decline in prices of industrial raw material continued
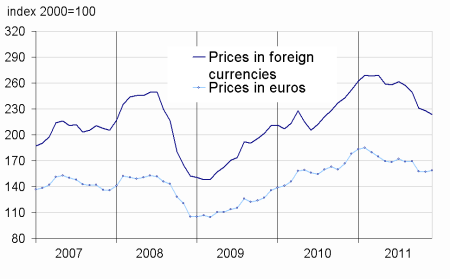
In December, the prices of industrial raw materials in foreign currencies continued to decline (-1.2% after -1.7% in November). On the one hand, the prices of mineral raw materials continued to decline (-1.6% after -0.6% in November). Among the nonferrous metals (-1.2% after -1,6%), the decrease in the prices of aluminium (-2.6%), zinc (-1.1%) and titanium (-5.8%) has been partly offset by an increase in the prices of lead (+1.8 %) and nickel (+1.6 %). The prices of copper have stabilized (+0.2% after +2.8% in November). The prices of precious metals have fallen sharply (-6.3% after -3.92% in November), including silver (-8.1%) and gold (-5.0%).
In the other hand, the prices of agro-industrial raw materials have stabilized (-0.1% after -4.5% in November). The decline of natural rubber prices has significantly reduced (-1.1% after -17.0%) and the price of sawn wood of conifers rebounded (+7.7% after -2.5%). However, he prices of natural textiles fibers continued to decline (-7.2% after –3.8%), especially cotton (-8.1%), as well as those of the pulp and paper (-3.6% after –0.3%).
The prices of raw food materials were down again
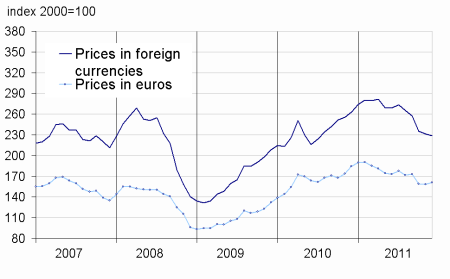
In December the prices of raw food materials in foreign currencies declined again (-3.0% after -1.1% in November).
The prices of tropical foodstuff have fallen sharply (-7.2% after -4.3%), including cocoa (-13.7%).
Similarly, the prices of cereals decreased again (-3.9% after +0.5% in November), notably maize (-4.0%) and rice (-3.8%).
tableautabpetrole – Oil and petroleum products
| Prices | Change (%) | |||
|---|---|---|---|---|
| of last month | over the last month | over the last 3 months | over the last 12 months | |
| Brent in $ per barrel | 108,1 | –2,4 | –2,4 | 17,8 |
| Brent in € per barrel | 82,2 | 0,6 | 2,2 | 18,4 |
| Gasoline | 918,0 | –0,6 | –10,3 | 10,6 |
| Gas Oil | 926,0 | –4,9 | –1,1 | 21,8 |
| Heavy fuel | 606,2 | –3,6 | –3,5 | 32,1 |
| Naphtha | 895,0 | 3,9 | –7,1 | 6,1 |
- Prices are in dollars per tonne unless otherwise specified
- Source : INSEE
tableautabmatprem – Imported raw materials (excluding energy) in domestic currency
| Index | Changes (%) | |||
|---|---|---|---|---|
| over last month | over the last 3 months | over the last 12 months | ||
| Food total | 238,8 | –3,0 | –9,2 | –7,9 |
| Tropical beverages | 228,2 | –7,2 | –17,6 | –14,5 |
| Oil seeds, vegetable oils | 254,4 | –0,9 | –8,3 | –13,3 |
| Cereals | 290,9 | –3,9 | –6,2 | 5,1 |
| Sugar | 287,5 | –4,5 | –15,5 | –24,9 |
| Beef meat | 159,6 | –0,2 | 1,4 | 13,4 |
| Industrial raw materials | 228,7 | –1,2 | –11,1 | –13,0 |
| Agricultural raw materials | 147,0 | –0,1 | –8,5 | –12,0 |
| Natural Fibers | 203,9 | –7,2 | –15,8 | –36,2 |
| Natural rubber | 425,8 | –1,1 | –24,1 | –26,8 |
| Hides | 90,0 | –6,1 | –12,5 | –20,6 |
| *Wood pulp | 133,3 | –3,6 | –5,4 | –3,0 |
| Tropical wood | 147,6 | –0,5 | –6,1 | –1,0 |
| Sawn softwood | 96,3 | 7,7 | –1,1 | –13,1 |
| Minerals | 271,5 | –1,6 | –12,1 | –13,4 |
| Iron ore | 522,5 | 0,0 | –15,1 | –17,3 |
| Non-ferrous metals | 232,8 | –1,2 | –10,9 | –15,7 |
| Precious metals | 414,3 | –6,3 | –13,8 | 10,5 |
| All commodities | 223,4 | –1,9 | –10,4 | –11,3 |
- Source : INSEE
- *The price ot pulp and paper has been revised in November.
graphiqueG_petrole_ang – Oil
- Source : NSEE
graphiqueG_alim_ang – Food
- Source : INSEE
graphiqueG_ensemble_ang – All commodities
- Source : INSEE
graphiqueG_indus_ang – Industrial raw materials
- Source : INSEE
Pour en savoir plus
Time series : Raw materials prices
