


 29 March 2013
2013- n° 72In February 2013, Households consumption of goods slightly decreased (-0.2%) Household consumption expenditure on goods - February 2013
29 March 2013
2013- n° 72In February 2013, Households consumption of goods slightly decreased (-0.2%) Household consumption expenditure on goods - February 2013
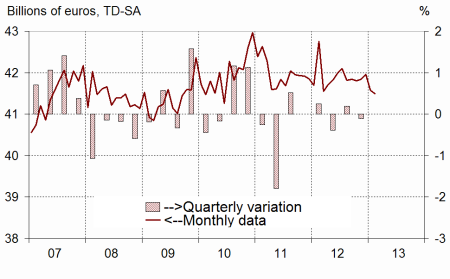
In February, households expenditure on goods decreased by 0.2% in volume*, after a 0.8% decrease in January. This decrease is mainly attributable to a fall in textile-leather purchases.
In February, households expenditure on goods decreased by 0.2% in volume*, after a 0.8% decrease in January. This decrease is mainly attributable to a fall in textile-leather purchases.
Engineered goods : decreasing
Durables: increasing
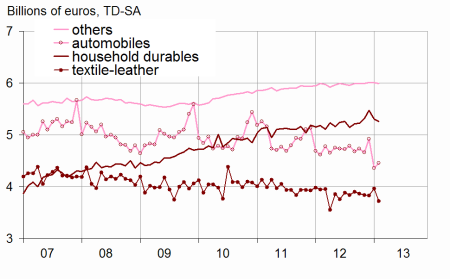
After a sharp decrease in January (-7.1%), households expenditure on durable goods increased in February (+0.9%). Car purchases, which fell in January (-11.5%) due to households expecting a strenghtening of penalties on the purchase of polluting cars from January 1st, slightly recovered in February (+2.4%). However, purchases in household durables decreased again in February (-0.9%, after -3.0%).
Textile-leather: sharply decreasing
In February, Households consumption of textile and leather declined by 6.1% after an increase in January (+3.5%).
Other engineered goods: slightly decreasing
In February, consumption expenditure on other engineered goods slightly decreased (-0.2% after –0.1% in January). Expenditure on hardware sharply decreased while consumption of health products were flat.
[* Volumes are chained and all figures are trading days and seasonally adjusted.]
graphiquegraph1_new_ang – Total consumption of goods
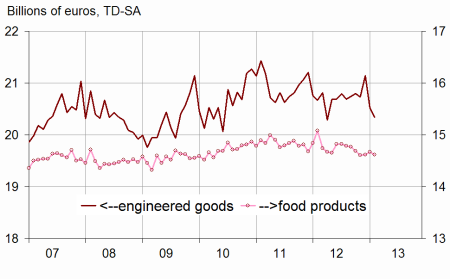
graphiquegraph2_new_ang – Food and engineered goods
graphiquegraph3_new_ang – Decomposition of engineered goods
Food products: slightly decreasing
Consumption of food products, which flattened in December (+0.1%) and slighlty increased in January (+0.3%), slightly decreased in February (–0.4%).
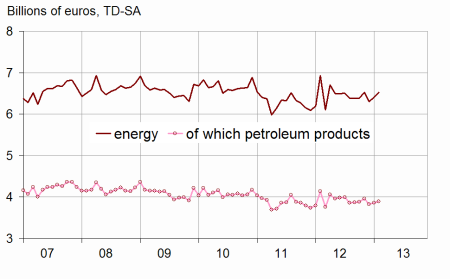
Energy: increasing
Households consumption of energy products increased again in February (+1.9% after +1.6% in January), due to below average temperatures.
The evolutions of household consumption of goods in January is scaled down by 0.1 point
The change of household consumption of goods is now estimated at –0.9% in January, instead of –0.8% estimated for the previous publication.
These revisions are mainly due to the integration of new information, notably regarding the expenditures on household durables, as well as the updating of the seasonal adjustment coefficients.
tableautab1_eng – Households consumption expenditures on goods
| Déc. | Janv. | Févr. | Févr.13/ | |
|---|---|---|---|---|
| 2012 | 2013 | 2013 | Févr.12 | |
| Food products | 14.620 | 14.670 | 14.615 | |
| Change (%) | 0.1 | 0.3 | –0.4 | –3.1 |
| Engineered goods | 21.140 | 20.521 | 20.338 | |
| change (%) | 2.0 | –2.9 | –0.9 | –1.6 |
| Of which: | ||||
| Automobiles | 4.921 | 4.353 | 4.456 | |
| Change (%) | 5.6 | –11.5 | 2.4 | –3.4 |
| Household durables | 5.470 | 5.308 | 5.259 | |
| Change (%) | 3.0 | –3.0 | –0.9 | 1.6 |
| Textile-leather | 3.829 | 3.962 | 3.721 | |
| Change (%) | –0.4 | 3.5 | –6.1 | –5.7 |
| Other engineered goods | 6.011 | 6.006 | 5.993 | |
| Change (%) | 0.3 | –0.1 | –0.2 | 0.0 |
| Energy | 6.304 | 6.406 | 6.526 | |
| Change (%) | –3.3 | 1.6 | 1.9 | –5.8 |
| Including petroleum products | 3.822 | 3.854 | 3.895 | |
| Change (%) | –3.4 | 0.8 | 1.1 | –5.8 |
| Total | 41.961 | 41.572 | 41.497 | |
| Change (%) | 0.3 | –0.9 | –0.2 | –2.9 |
| Manufactured goods | 36.431 | 35.875 | 35.621 | |
| Change (%) | 0.7 | –1.5 | –0.7 | –2.5 |
graphiquegraph4_new_ang – Energy
Documentation
Methodology (pdf,23 Ko)
Pour en savoir plus
