


 29 June 2012
2012- n° 164Producers prices of fresh vegetables and fruits increased noticeably in May 2012 Indices of agricultural prices - May 2012
29 June 2012
2012- n° 164Producers prices of fresh vegetables and fruits increased noticeably in May 2012 Indices of agricultural prices - May 2012
Price of cereals decreased in May (-1.2 %). The prospect of abundant harvests in the northern hemisphere made the price to go down. The investors also considered the global economical situation as a risk factor, by partly withdrawing from the futures market.
In May, producer prices of agricultural products rose compared to April (+0.1 %) ; year-over-year they went up by 1.3%.
Price of cereals decreased in May (-1.2 %). The prospect of abundant harvests in the northern hemisphere made the price to go down. The investors also considered the global economical situation as a risk factor, by partly withdrawing from the futures market.
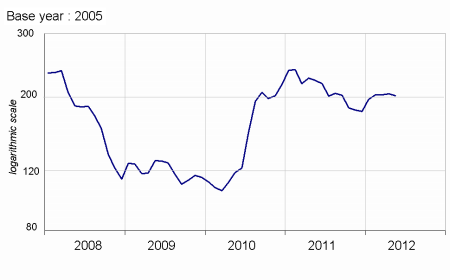
graphiquecereal – Producer price of cereals
Price of oleaginous decreased in May (-3.2 %). The decline of oil price made the biodoesel less competitive, a substituting fuel obtained from colza. The economical uncertainties weighed also on the price of colza, as for cereals.
Potato price falls in May year-over-year (–31.2 %). More surface areas were devoted to the culture of potatoes in North-West Europe and the yields were higher than last year.
Wine price increases sligthly in May (+0.8 %).
Price of fresh fruits increased in May year-over-year (+14.8 %). The rainy weather damaged cherries. The french strawberries sold easily due to a more moderate spanish competition than usually.
graphiquevegetable – Producer price of fresh vegetables
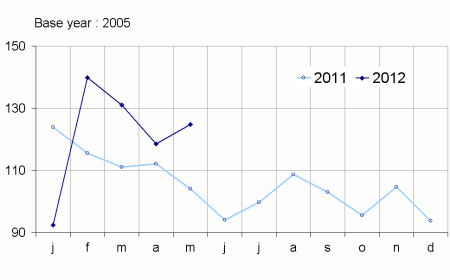
The price of fresh vegetable was higher in May that at the same period last year (+19.8 %). The low temperatures this spring diminished the supply of tomatoes and cucumbers. The rainy weather deteriorated a high quantity of salad plants. Lastly, endives farmers voluntarily restricted their productions to make the price go higher.
graphiquepig – Producer prices of pigs and large cattle
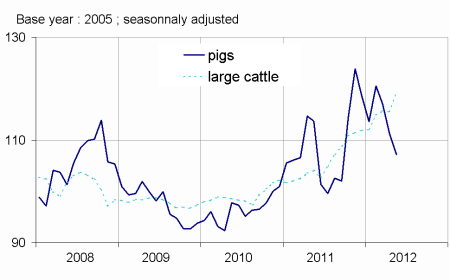
Price of animals went up in May (+0.5 %) on a seasonally adjusted basis. Prices of big cattle and poultry were dragged upwards by a dynamic demand. The price of pigs decreased : the for days labor weeks decreased the activity of slaughterhouses. Eggs kept on to be cheaper, the supply reinflating progressively. It stayed however on a sharp rise year-over-year (+145.0%), as a result of a previous sharp cut in the production : a European directive had ordered compliance to a new standard for hen coops, reducing the number of animals.
tableauTab1 – Indices of producer prices of agricultural products (IPPAP)
| Variation as % over : | |||||
|---|---|---|---|---|---|
| weights | May 2012 | a month | weights | April 2012 | |
| raw | seasonally adjusted data | raw | |||
| Agricultural goods output | 1000 | 131.0 | +0.1 | –0.8 | +1.3 |
| excluding fruits and vegetables | 878 | 132.3 | –0.3 | –0.6 | –0.2 |
| Crop output (excluding fruits and vegetables) | 417 | 146.1 | –0.3 | +0.1 | –5.2 |
| Cereals | 115 | 198.3 | –1.2 | –0.5 | –9.9 |
| of which soft wheat | 63 | 207.0 | –0.2 | +0.4 | –12.3 |
| grain maize | 27 | 179.6 | –3.3 | –1.3 | –11.2 |
| Potatoes | 19 | 123.1 | /// | /// | –31.2 |
| Wines | 161 | 122.3 | +0.8 | +0.6 | +0.9 |
| quality wines | 140 | 121.1 | +0.9 | +1.0 | +1.1 |
| other wines | 21 | 130.0 | +0.2 | –1.4 | –0.8 |
| Oleaginous | 28 | 219.2 | –3.2 | +5.2 | +3.7 |
| Horticultural products | 51 | 105.7 | –6.5 | –9.2 | –2.0 |
| Other crop products | 43 | 105.8 | +1.0 | +2.4 | +0.3 |
| Fruits and vegetables (1) | 122 | 122.0 | /// | /// | +15.0 |
| Fresh vegetables | 61 | 124.7 | /// | /// | +19.8 |
| Fresh fruits | 39 | 124.1 | /// | /// | +14.8 |
| Animal output | 461 | 119.7 | –0.3 | –1.4 | +5.8 |
| Animals | 286 | 119.6 | +0.5 | –1.2 | +3.3 |
| of which large cattle | 108 | 120.1 | +3.3 | +3.9 | +15.4 |
| calves | 29 | 118.7 | –0.6 | –2.0 | +2.8 |
| pigs | 64 | 109.0 | –3.8 | –11.1 | –5.8 |
| sheep | 14 | 116.3 | +0.9 | –4.3 | –1.9 |
| poultry | 59 | 135.4 | +1.0 | +2.0 | –2.9 |
| of which chicken | 26 | 134.5 | +0.9 | +2.2 | –2.4 |
| Milk | 159 | 106.6 | 0.0 | –4.2 | –1.6 |
| of which cow milk (2) | 148 | 107.0 | 0.0 | –4.5 | –1.7 |
| Eggs | 13 | 284.4 | –8.0 | +12.3 | +145.0 |
- (1) Including vegetables for industry.
- (2) The price for May is not yet known and therefore is estimated by carrying forward the seasonally adjusted price of April.
- Sources: INSEE - SSP (department of Agriculture)
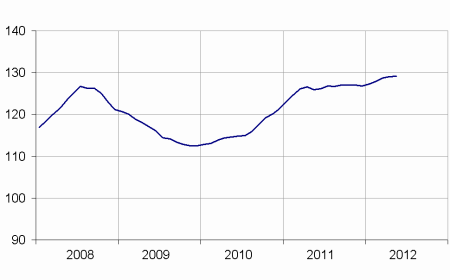
Purchase price of the means of agricultural production is almost stable in May.
The price of intermediate consumptions did not increase much, the drop of energy price being offset by the rise of the price of animals. The price of investment did not evolve much as well.
graphiqueMoyens_prod – Purchase price of the means of agricultural production
tableauTab2 – Indices of purchase prices of the means of agricultural production (IPAMPA)
| weights | May 2012 | Variation as % over | |||
|---|---|---|---|---|---|
| a month | 3 months | a year | |||
| Total input | 1000 | 129.1 | +0.1 | +0.9 | +2.5 |
| Goods and services currently consumed in agriculture | 758 | 132.1 | +0.1 | +1.1 | +2.9 |
| Energy (1) | 84 | 152.6 | –2.2 | –3.2 | +10.0 |
| Seeds | 51 | 116.9 | 0.0 | +0.5 | +4.3 |
| Fertilisers and soil improvers | 92 | 165.6 | –0.7 | 0.0 | +5.1 |
| Plant protection products | 77 | 106.6 | +0.4 | +1.7 | +0.6 |
| Animal feeding stuffs | 189 | 142.4 | +1.8 | +4.7 | +0.1 |
| Veterinary expenses | 38 | 117.7 | +0.1 | +1.0 | +3.0 |
| Small equipment and tools | 14 | 110.8 | +0.2 | +1.1 | +1.3 |
| Maintenance of materials | 56 | 128.7 | +0.5 | +0.7 | +2.6 |
| Maintenance of buildings | 9 | 123.6 | 0.0 | 0.0 | +2.1 |
| Other goods and services | 149 | 112.6 | –0.3 | +0.1 | +1.2 |
| Goods and services contributing to investment | 242 | 119.8 | +0.1 | +0.3 | +1.2 |
| Material | 170 | 116.8 | +0.2 | +0.4 | +1.1 |
| Tractors | 71 | 113.5 | 0.0 | +0.4 | +1.1 |
| Machinery and plant for cultivation | 36 | 119.2 | +0.3 | 0.0 | –0.8 |
| Machinery and plant for harvesting | 37 | 117.6 | +0.3 | +1.0 | +1.9 |
| Utility vehicles | 16 | 113.7 | 0.0 | +0.1 | +1.9 |
| Buildings | 72 | 127.1 | 0.0 | 0.0 | +1.4 |
- (1) The repayment of 5 cents per litre of fuel of the domestic tax on energetical products (TICPE) benefiting farmers has been applied in advance for the year 2012
- Sources: INSEE - SSP (department of Agriculture)
Documentation
Methodology (pdf,122 Ko)
Pour en savoir plus
Time series : Indices of agricultural prices
