


 21 December 2012
2012- n° 315In October 2012, the turnover in manufacturing industry went up by 0.9% compared
to September Turnover in industry and construction - October 2012
21 December 2012
2012- n° 315In October 2012, the turnover in manufacturing industry went up by 0.9% compared
to September Turnover in industry and construction - October 2012
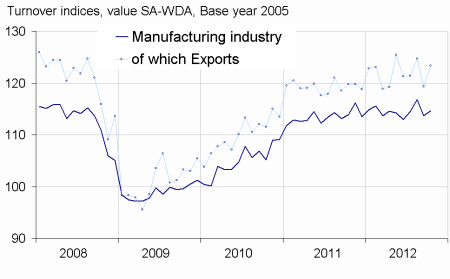
In October 2012, the turnover rose moderately in the manufacturing industry (+0.9%), after a significant fall in September. Exports increased strongly (+3.4%).

Every index in this issue is in value, seasonally and working-day adjusted.
In October 2012, the turnover rose moderately in the manufacturing industry (+0.9%), after a significant fall in September. Exports increased strongly (+3.4%).
In October 2012, the turnover grew considerably in the manufacture of food products and beverages (+4.4%) and in the manufacture of coke and refined petroleum products (+3.9%). The turnover shot up substantially in the electrical and electronic equipment; machine equipment (+2.2%), mainly in the manufacture of machinery and equipment n.e.c. (+2.9%) and in the manufacture of computer, electronic and optical products (+3.4%). It also increased slightly in other industries (+0.4%). On the other hand, the turnover of the manufacture of transport equipment fell sharply in October (–3.8%), notably in the manufacture of motor vehicles, trailers and semi-trailers (–8.1%).
In October 2012, the turnover of industry as a whole went up by 1.0%. Over the same period, it also rose in construction (+2.6%).
graphiqueIRgraph3 – Turnover in manufacturing industry
- Source: Insee
Over the third quarter (q-o-q), the turnover increased moderately in the manufacturing industry (+1.0%). It rose in the manufacture of coke and refined petroleum products (+6.2%) and in the manufacture of food products and beverages (+1.6%).
Year-on-year, the turnover increased sharply in the manufacturing industry (+1.1%).
tableauIRtab5 – Variation of the turnover in industry and construction
| Nace Classification | Change in % | ||||
|---|---|---|---|---|---|
| Sectors | Weight** | Oct./ Sept. | Sept./ Aug. | q-o-q (1) | y-o-y (2) |
| BE : INDUSTRY | 8022 | 1,0 | –2,4 | 0,8 | 1,1 |
| CZ : MANUFACTURING | 7167 | 0,9 | –2,7 | 1,0 | 1,1 |
| Of which Exports | 1017 | 3,4 | –4,3 | –0,2 | 2,3 |
| (C1): Manufacture of food products and beverages | 1131 | 4,4 | –3,0 | 1,6 | 3,8 |
| (C2): Manufacture of coke and refined petroleum products | 461 | 3,9 | –3,7 | 6,2 | 5,9 |
| (C3): Electrical and electronic equipment; machine equipment | 927 | 2,2 | –2,5 | 1,1 | –1,1 |
| (C4): Manufacture of transport equipment | 1383 | –3,8 | –1,6 | 0,9 | 1,8 |
| (C5): Other manufacturing | 3265 | 0,4 | –2,8 | 0,1 | –0,1 |
| (DE): Mining and quarrying; energy; water supply; waste management | 855 | 1,4 | –0,3 | –0,6 | 0,4 |
| FZ: CONSTRUCTION | 1978 | 2,6 | –3,2 | 0,3 | 0,7 |
- ** 10000=B..F
- (1) Quarter-on-quarter: last three months / three previous months
- (2) Year-on-year : last three months / three same months of previous year
- The codes correspond to different levels of aggregation of the NACE classification.
- Source: INSEE
Documentation
Methodology (pdf,140 Ko)
Pour en savoir plus
Time series : Turnover indices (VAT)
