


 29 June 2012
2012- n° 160In 2012 Q1, French households’ purchasing power was almost stable (–0.1 % after –0.2%),
GDP held steady (0.0%) Quarterly national accounts - detailed figures - 1st Quarter 2012
29 June 2012
2012- n° 160In 2012 Q1, French households’ purchasing power was almost stable (–0.1 % after –0.2%),
GDP held steady (0.0%) Quarterly national accounts - detailed figures - 1st Quarter 2012
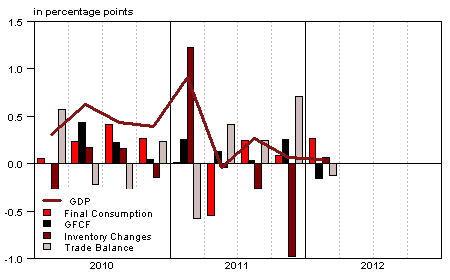
In 2012 Q1, French Gross Domestic Product (GDP) in volume terms* levelled off (0.0%) after a small increase in 2011 Q4 (+0.1%).
In 2012 Q1, French Gross Domestic Product (GDP) in volume terms* levelled off (0.0%) after a small increase in 2011 Q4 (+0.1%).
Households’ consumption expenditure remained slack (+0.2% after –0.1%). Gross fixed capital formation (GFCF) decreased (–0.7% after +1.3%). Overall, total domestic demand (excluding changes in inventories) drove GDP on for only 0.1 point of growth after 0.3 point in 2011 Q4.
Imports upturned (+0.8% after –1.5%), while exports slowed down (+0.2% after +1.3%). Hence foreign trade balance contributed negatively to GDP growth (–0.2 point after +0.8 point last quarter). Finally, changes in inventories contributed slightly to GDP growth: +0.1 point in Q1 after –1.0 point.
Households’ purchasing power was almost stable after two quarters of fall
In 2012 Q1, household’s purchasing power was almost stable (–0.1% after –0.2% in 2011 Q4). Taken individually (measured per consumption unit) it declined by 0.2% after –0.3% the previous quarter.
Households’ disposable income (HDI) increased by less than 0.6% after +0.4% in 2011 Q4 and consumption prices increased by more than 0.6%.
graphiqueGraph1 – GDP and its main components
tableauTab1 – GOODS AND SERVICES: SUPPLY AND USES CHAIN-LINKED VOLUMES
| 2011 Q2 | 2011 Q3 | 2011 Q4 | 2012 Q1 | 2011 | 2012 (ovhg) | |
|---|---|---|---|---|---|---|
| GDP | 0.0 | 0.3 | 0.1 | 0.0 | 1.7 | 0.2 |
| Imports | -0.9 | 0.5 | -1.5 | 0.8 | 5.2 | -0.2 |
| Households' consumption expenditure | -0.9 | 0.2 | -0.1 | 0.2 | 0.2 | 0.0 |
| General government's consumption expenditure | 0.0 | 0.2 | 0.2 | 0.5 | 0.2 | 0.7 |
| GFCF | 0.4 | 0.2 | 1.3 | -0.7 | 3.5 | 0.5 |
| of which Non financial corporated and unincorporated enterprises | -0.1 | -0.5 | 1.8 | -1.3 | 5.1 | -0.2 |
| Households | 1.3 | 1.2 | 0.5 | -0.3 | 3.2 | 1.0 |
| General government | 0.2 | 0.3 | 0.9 | -0.2 | -1.8 | 0.7 |
| Exports | 0.9 | 1.6 | 1.3 | 0.2 | 5.5 | 2.2 |
| Contributions : | ||||||
| Internal demand excluding inventory changes | -0.4 | 0.2 | 0.3 | 0.1 | 0.9 | 0.3 |
| Inventory changes | -0.1 | -0.2 | -1.0 | 0.1 | 0.8 | -0.8 |
| Net foreign trade | 0.5 | 0.3 | 0.8 | -0.2 | 0.0 | 0.7 |
tableauTab2 – Sectoral accounts
| 2010 Q4 | 2011 Q1 | 2011 Q2 | 2011 Q3 | 2010 | 2011 (ovhg) | |
|---|---|---|---|---|---|---|
| Profit ratio of NFC* (level) | 28.5 | 28.3 | 28.0 | 27.8 | 28.5 | |
| Household purchasing power | 0.3 | -0.3 | -0.2 | -0.1 | 0.5 | -0.3 |
- *NFC: non-financial corporations
tableauTab3 – GDP and components : prices indices
| 2011 Q2 | 2011 Q3 | 2011 Q4 | 2012 Q1 | 2011 | 2012 (ovhg) | |
|---|---|---|---|---|---|---|
| GDP | 0.4 | 0.3 | 0.5 | 0.2 | 1.3 | 0.9 |
| Imports | 0.1 | 0.8 | 1.0 | 0.8 | 5.4 | 2.0 |
| Cons. Exp. : | ||||||
| - Households | 0.5 | 0.4 | 0.6 | 0.6 | 2.1 | 1.4 |
| - GG* | 0.4 | 0.2 | 0.2 | 0.1 | 1.4 | 0.5 |
| Total GFCF | 0.7 | 0.6 | 0.6 | 0.8 | 2.9 | 1.7 |
| - of which Households | 1.5 | 1.1 | 0.5 | 1.0 | 3.8 | 2.3 |
| - of which NFE | 0.5 | 0.4 | 0.5 | 0.7 | 2.3 | 1.4 |
| - of which GG | 0.4 | 0.7 | 0.9 | 0.5 | 3.6 | 1.6 |
| Exports | 0.3 | 0.2 | 0.4 | 0.5 | 3.2 | 1.0 |
- *GG: General Government
tableauTab4 – Manufactured goods : supply and uses in volume
| 2011 Q2 | 2011 Q3 | 2011 Q4 | 2012 Q1 | 2011 | 2012 (ovhg) | |
|---|---|---|---|---|---|---|
| Industrie’s production | -0.9 | -0.1 | 0.2 | -0.9 | 3.2 | -1.0 |
| - of which value added | -1.1 | -0.2 | -0.5 | -0.5 | 0.7 | -1.3 |
| Imports | -0.1 | 0.3 | -1.9 | 1.7 | 6.7 | 0.3 |
| Intermediate uses | -0.3 | 0.2 | 0.3 | -0.2 | 2.9 | 0.1 |
| Cons. Exp. : | ||||||
| - of households | -1.5 | 0.3 | 0.3 | -0.7 | 0.9 | -0.7 |
| - of GG | 0.8 | 1.1 | 0.3 | 1.4 | 3.6 | 2.5 |
| Total GFCF | -0.4 | -1.0 | 2.6 | -3.2 | 7.3 | -1.9 |
| - of which NFC | -0.6 | -1.3 | 2.9 | -3.5 | 7.6 | -2.3 |
| - of which GG | 0.6 | 0.6 | 0.6 | 0.6 | -0.5 | 1.5 |
| Exports | 0.7 | 1.5 | 1.4 | 1.4 | 4.5 | 3.4 |
| Inventory changes (contribution) | -0.1 | -0.9 | -2.5 | 0.0 | 1.9 | -2.4 |
tableauTab5 – Households’ disposable income and ratios of households’ account
| 2011 Q2 | 2011 Q3 | 2011 Q4 | 2012 Q1 | 2011 | 2012 (ovhg) | |
|---|---|---|---|---|---|---|
| HDI | 0.9 | 0.1 | 0.4 | 0.6 | 2.6 | 1.1 |
| Household purchasing power | 0.3 | -0.3 | -0.2 | -0.1 | 0.5 | -0.3 |
| HDI by cu* (purchasing power) | 0.2 | -0.4 | -0.3 | -0.2 | -0.1 | -0.6 |
| Adjusted HDI (purchasing power) | 0.4 | -0.1 | -0.1 | 0.0 | 0.8 | 0.0 |
| Saving rate (level) | 16.7 | 16.3 | 16.1 | 15.9 | 16.2 | |
| Financial saving rate (level) | 7.7 | 7.1 | 6.9 | 6.7 | 7.1 |
- *cu: consumption unit
tableauTab6 – Ratios of non-financial corporations’ account
| 2011 Q2 | 2011 Q3 | 2011 Q4 | 2012 Q1 | 2011 | |
|---|---|---|---|---|---|
| Profit share | 28.5 | 28.3 | 28.0 | 27.8 | 28.5 |
| Investment ratio | 20.1 | 20.0 | 20.3 | 20.3 | 20.1 |
| Savings ratio | 13.4 | 13.0 | 13.0 | 13.0 | 13.5 |
| Self-financing ratio | 66.9 | 65.2 | 63.9 | 64.0 | 66.9 |
The acceleration of employment income and that of social benefits contributed to the HDI’s growth. Wages increased more rapidly than in Q4 (+0.6% after +0.4%) due to the joint acceleration of employment and average wage per capita. Social benefits in cash increased (+0.9% after +0.6%), buoyed up by pensions’ benefits and unemployment benefits. However, taxes on income and wealth weighed down a little more (+1.5% after +1.0%), in particular thanks to measures increasing social contribution.
Consumption in value increased (+0.8% after +0.5%) more rapidly than the HDI. Consequently, the savings ratio stepped back (from 16.1% to 15.9%), for the third quarter in a row.
Non-financial corporations’ profit ratio dropped again
In 2012 Q1, non-financial corporations’ (NFC) profit ratio decreased for the sixth quarter in a row (–0.2 point), to reach 27.8%. NFC’s profit ratio reached its lowest level since 1985 Q4.
The step back of their margin in Q1 came from a decrease in NFC’s value added, while wages kept on increasing. NFC’s value added stepped back (–0.2% after +0.5%), partly because of an increase in intermidiate consumption prices. By contrast compensations of employees though still increasing, slowed down (+0.2% after +0.9%). Wages progressed almost at the same rate as in 2011 Q4 (+0.7% after +0.6%): employment (0.0% after –0.1%) and average wage per capita (+0.7% after +0.8%) progressed at the same rate as in 2011 Q4. On the contrary, employers’ social contributions dropped (–1.4% after +1.6%) after being dynamic at the end of 2011 due to the annualisation of rebates on social contributions.
GDP growth’s estimation is not revised
With respect to the previous release, GDP growth’s estimation is unchanged, in 2012 Q1 and in previous quarters. Some small revisions (due to the integration of information known since the first publication, re-estimation of seasonal adjustment coefficients) cancel each other out. Moreover HDI’s profile is revised in 2011 (without changes in the annual evolution): it decreased in 2011 Q3 (–0.3%) and in 2011 Q4 (–0.2%) against a stability in the previous release.
Pour en savoir plus
