


 28 December 2012
2012- n° 321In Q3, French GDP was almost stable (+0.1% after –0.1%) while household purchasing
power slowed down (0.0% after +0.3%) Quarterly national accounts - detailed figures - 3rd Quarter 2012
28 December 2012
2012- n° 321In Q3, French GDP was almost stable (+0.1% after –0.1%) while household purchasing
power slowed down (0.0% after +0.3%) Quarterly national accounts - detailed figures - 3rd Quarter 2012
In 2012 Q3, French gross domestic product (GDP) in volume terms* rose by 0.1%, after a 0.1% decrease over the previous quarter.
In 2012 Q3, French gross domestic product (GDP) in volume terms* rose by 0.1%, after a 0.1% decrease over the previous quarter.
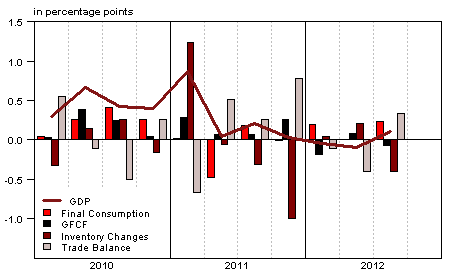
Household consumption expenditure recovered (+0.2% after –0.2%) while gross fixed capital formation (GFCF) decreased (–0.3% after +0.4%). Overall, total domestic demand (excluding inventory changes) contributed positively to GDP: 0.2 percentage point after 0.1 percentage point. Imports fell (–0.5% after +1.6%) and exports slightly accelerated (+0.6% after +0.3%). Hence, the foreign trade balance contributed positively to GDP growth: 0.3 percentage point (after –0.4 percentage point). This contribution is offset by changes in inventories contribution: –0.4 percentage point in Q3, after +0.2 point.
Individual-level purchasing power declined
Wages earned by households slightly accelerated (+0.5% after +0.4%) and social benefits dynamism did not weaken (+0.9% after +0.9%). However, taxes on income and wealth surged (+3.8% after +0.9%). They were buoyed up by budget consolidation measures passed for 2012: deindexation of the income tax rate for natural persons, closing of certain tax loopholes, establishment of an exceptional contribution on high incomes, reinforcement of capital gains taxation. Hence, in nominal terms, household disposable income slowed down in 2012 Q3 (+0.2% after +0.5%).
graphiqueGraph1 – GDP and its main components
tableauTab1 – GOODS AND SERVICES: SUPPLY AND USES CHAIN-LINKED VOLUMES
| 2011 Q4 | 2012 Q1 | 2012 Q2 | 2012 Q3 | 2011 | 2012 (ovhg) | |
|---|---|---|---|---|---|---|
| GDP | 0.0 | 0.0 | -0.1 | 0.1 | 1.7 | 0.1 |
| Imports | -1.0 | 0.3 | 1.6 | -0.5 | 5.2 | 0.2 |
| Households' consumption *expenditure | -0.1 | 0.1 | -0.2 | 0.2 | 0.2 | -0.1 |
| General government's *consumption expenditure | 0.2 | 0.5 | 0.5 | 0.4 | 0.2 | 1.3 |
| GFCF | 1.3 | -0.9 | 0.4 | -0.3 | 3.5 | 0.5 |
| *of which Non financial corporated and unincorporated enterprises | 1.8 | -1.5 | 0.5 | -0.6 | 5.1 | -0.3 |
| Households | 0.4 | -0.4 | 0.0 | 0.0 | 3.2 | 0.8 |
| General government | 1.1 | -0.2 | 1.0 | 0.0 | -1.8 | 1.6 |
| Exports | 1.8 | -0.1 | 0.3 | 0.6 | 5.5 | 2.4 |
| Contributions : | ||||||
| Internal demand excluding inventory changes | 0.3 | 0.0 | 0.1 | 0.2 | 0.9 | 0.4 |
| Inventory changes | -1.0 | 0.0 | 0.2 | -0.4 | 0.8 | -0.9 |
| Net foreign trade | 0.8 | -0.1 | -0.4 | 0.3 | 0.0 | 0.6 |
tableauTab2 – Sectoral accounts
| 2011 Q4 | 2012 Q1 | 2012 Q2 | 2012 Q3 | 2011 | 2012 (ovhg) | |
|---|---|---|---|---|---|---|
| Profit ratio of NFC* (level) | 28.2 | 27.9 | 28.2 | 28.3 | 28.5 | |
| Household purchasing power | -0.3 | -0.1 | 0.3 | 0.0 | 0.5 | 0.0 |
- *NFC: non-financial corporations
tableauTab3 – GDP and components : prices indices
| 2011 Q4 | 2012 Q1 | 2012 Q2 | 2012 Q3 | 2011 | 2012 (ovhg) | |
|---|---|---|---|---|---|---|
| GDP | 0.5 | 0.3 | 0.6 | 0.4 | 1.3 | 1.6 |
| Imports | 0.9 | 0.9 | -0.5 | 0.3 | 5.4 | 1.6 |
| Cons. Exp. : | ||||||
| - Households | 0.6 | 0.7 | 0.2 | 0.2 | 2.1 | 1.7 |
| - GG* | 0.2 | 0.1 | 0.1 | 0.2 | 1.4 | 0.6 |
| Total GFCF | 0.5 | 0.8 | 0.5 | 0.3 | 2.9 | 2.2 |
| - of which Households | 0.5 | 0.9 | 0.9 | 0.5 | 3.8 | 3.2 |
| - of which NFE | 0.5 | 0.8 | 0.3 | 0.2 | 2.3 | 1.9 |
| - of which GG | 0.8 | 0.5 | 0.3 | 0.5 | 3.6 | 2.1 |
| Exports | 0.4 | 0.7 | -0.4 | 0.9 | 3.2 | 1.3 |
- *GG: General Government
tableauTab4 – Manufactured goods : supply and uses in volume
| 2011 Q4 | 2012 Q1 | 2012 Q2 | 2012 Q3 | 2011 | 2012 (ovhg) | |
|---|---|---|---|---|---|---|
| Industrie’s production | 0.4 | -1.2 | -1.1 | 0.8 | 3.2 | -1.6 |
| - of which value added | -0.3 | -0.9 | -0.7 | 0.6 | 0.7 | -1.9 |
| Imports | -1.3 | 1.0 | 2.5 | -1.3 | 6.7 | 0.9 |
| Intermediate uses | 0.4 | -0.4 | -0.6 | 0.4 | 2.9 | -0.5 |
| Cons. Exp. : | ||||||
| - of households | 0.3 | -0.6 | -0.5 | 0.6 | 0.9 | -0.7 |
| - of GG | 0.5 | 1.7 | 1.4 | 0.8 | 3.6 | 4.4 |
| Total GFCF | 2.4 | -3.4 | 0.2 | -0.6 | 7.3 | -2.3 |
| - of which NFC | 2.7 | -3.8 | 0.3 | -0.7 | 7.6 | -2.7 |
| - of which GG | 0.6 | 0.6 | 0.5 | 0.5 | -0.5 | 2.1 |
| Exports | 2.3 | 0.7 | 0.3 | 1.5 | 4.5 | 3.8 |
| Inventory changes (contribution) | -2.5 | 0.0 | 0.7 | -1.3 | 1.9 | -2.5 |
tableauTab5 – Households’ disposable income and ratios of households’ account
| 2011 Q4 | 2012 Q1 | 2012 Q2 | 2012 Q3 | 2011 | 2012 (ovhg) | |
|---|---|---|---|---|---|---|
| HDI | 0.3 | 0.6 | 0.5 | 0.2 | 2.6 | 1.6 |
| Household purchasing power | -0.3 | -0.1 | 0.3 | 0.0 | 0.5 | 0.0 |
| HDI by cu* (purchasing power) | -0.4 | -0.2 | 0.2 | -0.2 | -0.1 | -0.6 |
| Adjusted HDI (purchasing power) | -0.2 | 0.0 | 0.3 | 0.1 | 0.8 | 0.3 |
| Saving rate (level) | 16.1 | 16.0 | 16.4 | 16.2 | 16.2 | |
| Financial saving rate (level) | 6.9 | 6.8 | 7.2 | 7.0 | 7.1 |
- *cu: consumption unit
tableauTab6 – Ratios of non-financial corporations’ account
| 2011 Q4 | 2012 Q1 | 2012 Q2 | 2012 Q3 | 2011 | |
|---|---|---|---|---|---|
| Profit share | 28.2 | 27.9 | 28.2 | 28.3 | 28.5 |
| Investment ratio | 20.3 | 20.2 | 20.2 | 20.0 | 20.1 |
| Savings ratio | 13.1 | 13.1 | 13.6 | 13.7 | 13.5 |
| Self-financing ratio | 64.4 | 65.1 | 67.2 | 68.8 | 66.9 |
Consumption prices grew at the same pace as over the previous quarter (+0.2%). Overall, household purchasing power remained flat this quarter, after a 0.3% rise in 2012 Q2. Taken individually (measured per consumption unit), it declined by 0.2% after a 0.2% rise in Q2.
Household’s consumption in nominal terms accelerated (+0.4% after 0.0%) and increased faster than nominal income. Hence, the saving ratio slightly decreased from 16.4% to 16.2%.
The profit margin of non-financial corporations was almost stable
The non-financial corporations value added increased at the same pace as over the previous quarter (+0.8% in current prices). Wages paid slightly accelerated (+0.5% after +0.4%) because employment decrease (–0.2% after four quarters of stability) was offset by wage per capita acceleration (+0.7% after +0.4%). Taxes on production accelerated (+1.9% after +1.1%). Overall, value added growth remaining superior to that of wages and taxes taken together, gross operating surplus went on increasing (+1.4% after +1.6%) and their profit margin was almost stable (28.3% after 28.2%).
GPD evolution in Q3 is scaled down
GDP growth estimation in Q3 is revised by 0.1 percentage point from a previously estimated growth of 0.2%. This is due to the integration of data released since then. In particular, transport production is now valued with the integration of the road freight transport indicator. Besides, GFCF and consumption in services are overall a little less dynamic with the integration of the turnover indices for September. Carried-over GDP growth for the whole year is also revised by 0.1 percentage point to +0.1%.
Pour en savoir plus
