


 15 June 2012
2012- n° 149In May 2012, the prices of oil fell Prices of oil and raw material imports - May 2012
15 June 2012
2012- n° 149In May 2012, the prices of oil fell Prices of oil and raw material imports - May 2012
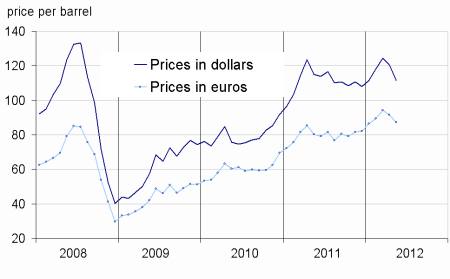
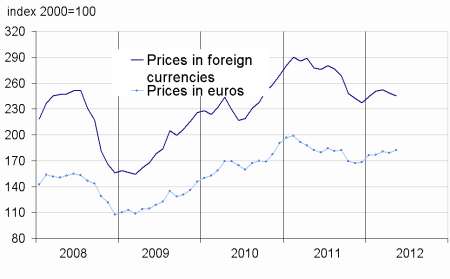
In May, the price of oil in dollars fell significantly (–7.6% after –3.1%) in April). It stood at $111.5 per barrel Brent. The foreign currency prices for non-energy commodities imported into France also recorded a further decline (-1.4% as in April).
In May, the price of oil in dollars fell significantly (–7.6% after –3.1%) in April). It stood at $111.5 per barrel Brent. The foreign currency prices for non-energy commodities imported into France also recorded a further decline (-1.4% as in April).
The drop in the oil prices increased
In Jmay, the dollar price of oil from the North Sea (Brent) continued to fall (-7.6% after -3.1%). In euros, the decline in oil prices was slightly less sensitive (-4.9 % after –2.7 %), because the depreciation of the euro against the dollar continued (-2.9%). The price per barrel dollar found again its level in January 2012.
The prices of industrial raw material continued to decline
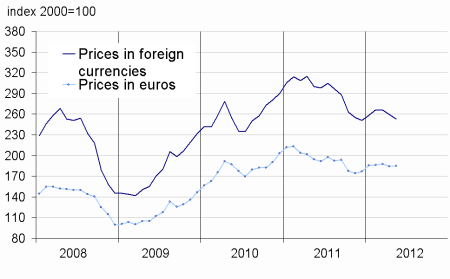
In May, the prices of industrial raw materials in foreign currencies continued to fall (-2.6% after -2.1% in April). Lower prices of mineral raw materials increased (-4.4% after -2.8%). The prices of nonferrous metals declined again (-3.3% after –4.0%), including those of copper (-4.1%), nickel (-4.9%), zinc (-3.8%) and a lesser extent to aluminium (-2.2%). Meanwhile, the prices of precious metals fell sharply (-6.3% after –2.9%), mainly those of silver (-9.1%) and gold (–3.9%).
The prices of agro-industrial raw materials however rebounded (+2.8% after –0.2%) The price of sawn softwood of conifers accelerated (+8.9%) and those of of wood pulp have continued to rise (+0.8%). Prices of natural textile fibers however folded (-10.6%), due to the significant decline in cotton prices (-11.3%). They suffered from the slowdown of activity in China which is about 40% of global consumption of cotton.
The prices of raw food materials became stronger
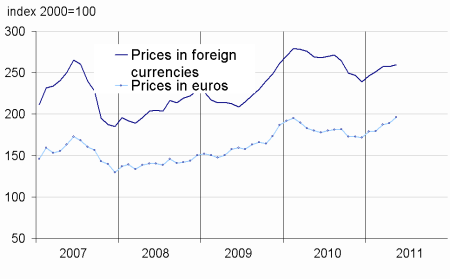
In May, the prices of raw food materials in foreign currencies increased (+0.8% after +0.0% in April). The tropical
foodstuffs prices recovered (+0.9% after –3.5%), including cocoa (+1.5%) and robusta (+3.8%). The cereals prices accelerated (+2.0% after +0.2%), with the rising prices of rice (+4.3%), supported by high purchase before Ramadan. But, corn prices continued to decline (-2.7%). The prices of oilseeds also grew but at slower pace than in April (+1.3% after +5.8%). In contrast, sugar prices fell again sharply (-11.9% after –7.1%) due to improved supply.
tableautabpetrole – Oil and petroleum products
| Prices | Change (%) | |||
|---|---|---|---|---|
| of last month | over the last month | over the last 3 months | over the last 12 months | |
| Brent in $ per barrel | 111,5 | –7,6 | –5,7 | –3,1 |
| Brent in € per barrel | 87,1 | –4,9 | –2,5 | 8,6 |
| Gasoline | 1021,5 | –12,3 | –2,6 | –4,7 |
| Gas Oil | 933,8 | –7,1 | –7,1 | –0,4 |
| Heavy fuel | 626,7 | –7,7 | –7,9 | 3,8 |
| Naphtha | 882,2 | –14,8 | –14,1 | –10,8 |
- Prices are in dollars per tonne unless otherwise specified
- Source : INSEE
tableautabmatprem – Imported raw materials (excluding energy) in domestic currency
| Index | Changes (%) | |||
|---|---|---|---|---|
| over the last month | over the last 3 months | over the last 12 months | ||
| Food total | 259,7 | 0,9 | 3,3 | –3,6 |
| Tropical foodstuff | 225,7 | 0,9 | –4,7 | –24,4 |
| Oil seeds, vegetable oils | 313,9 | 1,3 | 15,2 | 8,4 |
| Cereals | 302,1 | 2,0 | 1,5 | 6,2 |
| Sugar | 248,6 | –11,9 | –18,6 | –7,3 |
| Beef meat | 170,7 | 2,4 | 0,1 | 7,8 |
| Industrial raw materials | 253,0 | –2,6 | –5,0 | –15,7 |
| Agricultural raw materials | 152,3 | 2,8 | 4,6 | –5,2 |
| Natural Fibers | 185,0 | –10,6 | –12,1 | –43,7 |
| Natural rubber | 454,0 | 0,4 | –0,4 | –17,2 |
| Hides | 107,1 | 1,7 | 8,4 | 2,0 |
| Wood pulp | 125,0 | 0,8 | 1,1 | –15,1 |
| Tropical wood | 147,5 | –0,5 | 0,8 | –7,0 |
| Sawn softwood | 118,7 | 8,9 | 15,8 | 34,4 |
| Minerals | 306,5 | –4,4 | –8,0 | –19,0 |
| Iron ore | 1094,5 | –7,7 | –2,9 | –23,1 |
| Non-ferrous metals | 233,0 | –3,3 | –8,8 | –19,0 |
| Precious metals | 400,6 | –6,3 | –12,0 | –10,2 |
| All commodities | 245,2 | –1,4 | –2,1 | –11,7 |
- Source : INSEE
graphiqueG_petrole_ang – Oil
- Source : INSEE
graphiqueG_alim_ang – Food
- Source : INSEE
graphiqueG_ensemble_ang – All commodities
- Source : INSEE
graphiqueG_indus_ang – Industrial raw materials
- Source : INSEE
Pour en savoir plus
Time series : Raw materials prices
