


 31 July 2013
2013- n° 181Despite a decrease in June (-0.8%), households consumption of goods increased in the
second quarter (+0.3%) Household consumption expenditure on goods - June 2013
31 July 2013
2013- n° 181Despite a decrease in June (-0.8%), households consumption of goods increased in the
second quarter (+0.3%) Household consumption expenditure on goods - June 2013
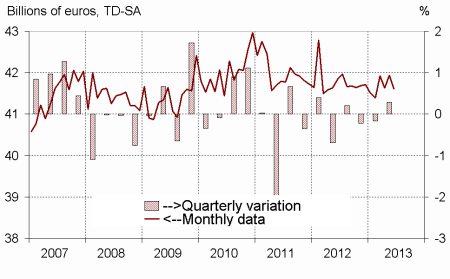
In June, households expenditure on goods decreased by 0.8% in volume*, after a 0.7% increase in May. Over the second quarter, they increased by 0.3% (after –0.2% in Q1 2013). The decline in June was mainly attributable to a decrease in the consumption of energy products. Over the quarter, the growth in expenditure on durable goods and energy products offset the decline in consumption of food products.
In June, households expenditure on goods decreased by 0.8% in volume*, after a 0.7% increase in May. Over the second quarter, they increased by 0.3% (after –0.2% in Q1 2013). The decline in June was mainly attributable to a decrease in the consumption of energy products. Over the quarter, the growth in expenditure on durable goods and energy products offset the decline in consumption of food products.
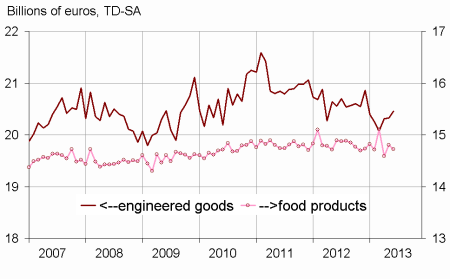
Engineered goods : increasing
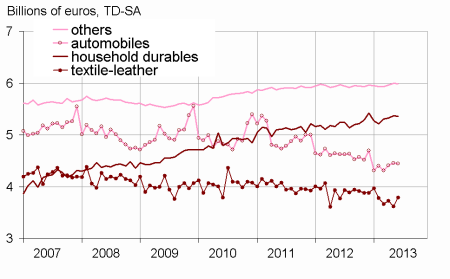
Durables: slightly decreasing
After an increase in May (+0.8%), households expenditure on durable goods decreased in June (–0.3%). They rose over the second quarter (+1.8%, after –3.2% in Q1). Expenditure on cars were almost stable in June (–0.1%, after +0.9% in May), increasing over the quarter (+2.2% after –5.5% in Q1). Purchases in household durables declined in June as well (–0.3%, after +0.8% in May), but rose over the quarter (+1.7%, after –0.9% in Q1).
Textile-leather: bounce
After a decline in May (–2.8%), households consumption of textile and leather bounced in June (+4.6%). However, it decreased again over the quarter (–2.4%), after a fall in Q1 (–2.2%).
Other engineered goods: decreasing
Consumption expenditure on other engineered goods slightly declined in June (–0.3%, after +0.7% in May), particularly on hardware. They picked up over the second quarter (+0.7%), after a near-stability over the first quarter (–0.1%).
[* Volumes are chained and all figures are trading days and seasonally adjusted.]
graphiquegraph1_new_ang – Total consumption of goods
graphiquegraph2_new_ang – Food and engineered goods
graphiquegraph3_new_ang – Decomposition of engineered goods
Food products: downturn
Consumption of food products decreased in June (–0.6%), after a growth in May (+1.5%). It declined anew over the quarter (–1.2%, after +1.0% in Q1).
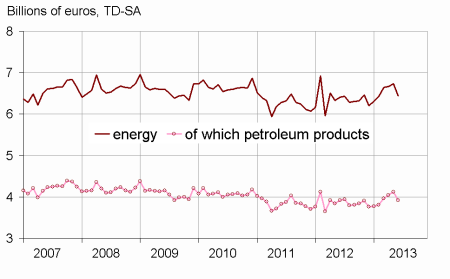
Energy: fall in June, sharp increase over the quarter
After five consecutive months of increase, linked to below average temperatures, households consumption of energy products weakened noticeably in June (–4.3%). It accelerated in spring (+2.4%), after an already estimated increase this past winter (+2.0%).
The May increase is scaled up by 0.2 point
The increase in consumption of goods is now estimated at +0.7% in May, instead of +0.5% for the previous estimation.
These revisions are mainly due to the integration of new information and to the reestimation of calendar and seasonal adjustment models, especially in energy expenditures.
tableau – Households consumption expenditures on goods
| Avril | Mai | Juin | Juin 13/ | Q2 13/ | |
|---|---|---|---|---|---|
| 2013 | 2013 | 2013 | Juin 12 | Q1 13 | |
| Food products | 14.591 | 14.805 | 14.721 | ||
| Change (%) | –3.4 | 1.5 | –0.6 | –1.1 | –1.2 |
| Engineered goods | 20.315 | 20.324 | 20.459 | ||
| change (%) | 1.2 | 0.0 | 0.7 | –0.5 | 0.6 |
| Of which: | |||||
| Automobiles | 4.411 | 4.450 | 4.444 | ||
| Change (%) | 2.4 | 0.9 | –0.1 | –3.9 | 2.2 |
| Household durables | 5.327 | 5.370 | 5.357 | ||
| Change (%) | 0.5 | 0.8 | –0.3 | 2.2 | 1.7 |
| Textile-leather | 3.728 | 3.623 | 3.791 | ||
| Change (%) | 1.7 | –2.8 | 4.6 | 0.7 | –2.4 |
| Other engineered goods | 5.960 | 6.000 | 5.985 | ||
| Change (%) | 0.5 | 0.7 | –0.3 | 0.3 | 0.7 |
| Energy | 6.671 | 6.730 | 6.438 | ||
| Change (%) | 0.4 | 0.9 | –4.3 | 0.4 | 2.4 |
| Including petroleum products | 4.040 | 4.117 | 3.923 | ||
| Change (%) | 1.8 | 1.9 | –4.7 | 0.2 | 4.5 |
| Total | 41.635 | 41.939 | 41.614 | ||
| Change (%) | –0.7 | 0.7 | –0.8 | –0.5 | 0.3 |
| Manufactured goods | 35.740 | 36.065 | 35.907 | ||
| Change (%) | –0.5 | 0.9 | –0.4 | –0.8 | 0.4 |
graphiquegraph4_new_ang – Energy
Documentation
Methodology (pdf,23 Ko)
Pour en savoir plus
