

 15 November 2012
2012- n° 280In 2012 Q3 French GDP inched up (+0.2% after –0.1%) Quarterly national accounts - second estimate - 3rd quarter 2012
15 November 2012
2012- n° 280In 2012 Q3 French GDP inched up (+0.2% after –0.1%) Quarterly national accounts - second estimate - 3rd quarter 2012
In 2012 Q3, French gross domestic product (GDP) in volume terms* increased by 0.2% after a –0.1% decrease over the previous quarter.
In 2012 Q3, French gross domestic product (GDP) in volume terms* increased by 0.2% after a –0.1% decrease over the previous quarter.
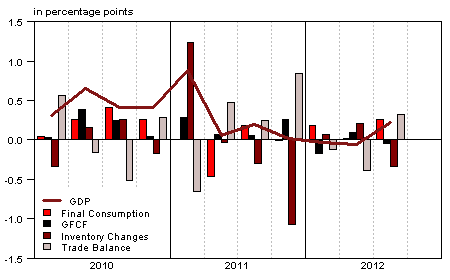
Household consumption expenditure recovered marginally (+0.3% after –0.2%), while gross fixed capital formation (GFCF) slightly decreased (–0.2% after +0.5%). Overall, total domestic demand (excluding inventory changes) contributed positively to GDP growth driving it on for 0.2 point of growth after 0.1 percentage point in Q2. Exports slightly accelerated (+0.5% after +0.3%) whereas imports fell as repercussions of a dynamic second quarter (–0.6% after +1.6%). Hence, the foreign trade balance contributed positively to GDP growth: +0.3 percentage point after –0.4 percentage point. This contribution is compensated by changes in inventories which contributed –0.3 percentage point to GDP growth (after +0.2 point).
Total production accelerated
After five quarters of near stagnation, production of goods and services increased anew (+0.4%). Production in manufactured goods rose by 1.0% (after –1.0% the first two quarters of this year) thanks to the upturn of production in transport equipment (+3.2% after –3.2%) and in coke and refined petroleum (+5.5% after –2.0%). Moreover, production in services slightly accelerated (+0.4% after +0.2%). However, production in construction slowed down (+0.1% after +0.5%) and production in energy, water and waste stepped back (–1.4% after +2.2%).
Renewed growth in consumption
Household consumption expenditure increased by 0.3% in 2012 Q3 after a 0.2% dip in Q2. Food expenditure increased (+0.7% after –1.2%), so did clothing expenditure (+3.9% after –5.9%). On the contrary, consumption of energy fell as repercussions of low temperatures in Spring (–2.5% after +3.0%). Expenditures in services slightly increased (+0.2% after –0.1%).
graphiqueGraph1 – GDP and its main components
tableauTab1 – GOODS AND SERVICES: SUPPLY AND USES CHAIN-LINKED VOLUMES
| 2011 Q4 | 2012 Q1 | 2012 Q2 | 2012 Q3 | 2011 | 2012 (ovhg) | |
|---|---|---|---|---|---|---|
| GDP | 0.0 | 0.0 | -0.1 | 0.2 | 1.7 | 0.2 |
| Imports | -1.2 | 0.5 | 1.6 | -0.6 | 5.2 | 0.1 |
| Households' consumption expenditure | -0.1 | 0.1 | -0.2 | 0.3 | 0.2 | 0.0 |
| General government's consumption expenditure | 0.2 | 0.5 | 0.4 | 0.4 | 0.2 | 1.3 |
| GFCF | 1.3 | -0.9 | 0.5 | -0.2 | 3.5 | 0.6 |
| of which Non financial corporated and unincorporated enterprises | 1.7 | -1.5 | 0.6 | -0.4 | 5.1 | -0.1 |
| Households | 0.5 | -0.4 | 0.0 | -0.1 | 3.2 | 0.8 |
| General government | 1.1 | -0.2 | 1.0 | 0.1 | -1.8 | 1.6 |
| Exports | 1.9 | 0.0 | 0.3 | 0.5 | 5.5 | 2.5 |
| Contributions : | ||||||
| Internal demand excluding inventory changes | 0.2 | 0.0 | 0.1 | 0.2 | 0.9 | 0.4 |
| Inventory changes | -1.1 | 0.1 | 0.2 | -0.3 | 0.8 | -0.9 |
| Net foreign trade | 0.8 | -0.1 | -0.4 | 0.3 | 0.0 | 0.6 |
tableauTab2 – Sectoral accounts
| 2011 Q4 | 2012 Q1 | 2012 Q2 | 2012 Q3 | 2011 | 2012 (ovhg) | |
|---|---|---|---|---|---|---|
| Profit ratio of NFC* (level) | 28.1 | 27.9 | 28.2 | 28.5 | ||
| Household purchasing power | -0.2 | 0.0 | 0.4 | 0.5 | 0.1 |
- *NFC: non-financial corporations
tableauTab3 – GDP and components : prices indices
| 2011 Q4 | 2012 Q1 | 2012 Q2 | 2012 Q3 | 2011 | 2012 (ovhg) | |
|---|---|---|---|---|---|---|
| GDP | 0.5 | 0.3 | 0.5 | 0.4 | 1.3 | 1.6 |
| Imports | 0.9 | 0.8 | -0.7 | 0.7 | 5.4 | 1.7 |
| Cons. Exp. : | ||||||
| - Households | 0.6 | 0.7 | 0.2 | 0.2 | 2.1 | 1.7 |
| - GG* | 0.1 | 0.1 | 0.1 | 0.2 | 1.4 | 0.6 |
| Total GFCF | 0.5 | 0.8 | 0.5 | 0.4 | 2.9 | 2.2 |
| - of which Households | 0.5 | 0.9 | 0.9 | 0.6 | 3.8 | 3.2 |
| - of which NFE | 0.5 | 0.8 | 0.3 | 0.3 | 2.3 | 1.9 |
| - of which GG | 0.9 | 0.5 | 0.3 | 0.5 | 3.6 | 2.1 |
| Exports | 0.4 | 0.7 | -0.3 | 1.0 | 3.2 | 1.4 |
- *GG: General Government
tableauTab4 – Manufactured goods : supply and uses in volume
| 2011 Q4 | 2012 Q1 | 2012 Q2 | 2012 Q3 | 2011 | 2012 (ovhg) | |
|---|---|---|---|---|---|---|
| Industrie’s production | 0.2 | -1.0 | -1.0 | 1.0 | 3.2 | -1.5 |
| - of which value added | -0.6 | -0.7 | -0.7 | 0.7 | 0.7 | -1.8 |
| Imports | -1.6 | 1.3 | 2.5 | -1.3 | 6.7 | 1.0 |
| Intermediate uses | 0.3 | -0.3 | -0.5 | 0.6 | 2.9 | -0.3 |
| Cons. Exp. : | ||||||
| - of households | 0.3 | -0.7 | -0.5 | 0.7 | 0.9 | -0.7 |
| - of GG | 0.6 | 1.8 | 1.3 | 1.4 | 3.6 | 4.7 |
| Total GFCF | 2.3 | -3.4 | 0.4 | -0.2 | 7.3 | -2.1 |
| - of which NFC | 2.5 | -3.8 | 0.4 | -0.3 | 7.6 | -2.5 |
| - of which GG | 0.7 | 0.6 | 0.5 | 0.4 | -0.5 | 2.1 |
| Exports | 2.3 | 0.8 | 0.4 | 1.3 | 4.5 | 3.8 |
| Inventory changes (contribution) | -2.8 | 0.1 | 0.7 | -1.2 | 1.9 | -2.5 |
tableauTab5 – Households’ disposable income and ratios of households’ account
| 2011 Q4 | 2012 Q1 | 2012 Q2 | 2012 Q3 | 2011 | 2012 (ovhg) | |
|---|---|---|---|---|---|---|
| HDI | 0.4 | 0.7 | 0.6 | 2.6 | 1.7 | |
| Household purchasing power | -0.2 | 0.0 | 0.4 | 0.5 | 0.1 | |
| HDI by cu* (purchasing power) | -0.4 | -0.1 | 0.2 | -0.1 | -0.4 | |
| Adjusted HDI (purchasing power) | -0.1 | 0.1 | 0.4 | 0.8 | 0.3 | |
| Saving rate (level) | 16.1 | 16.1 | 16.5 | 16.2 | ||
| Financial saving rate (level) | 6.9 | 6.8 | 7.2 | 7.1 |
- *cu: consumption unit
tableauTab6 – Ratios of non-financial corporations’ account
| 2011 Q4 | 2012 Q1 | 2012 Q2 | 2012 Q3 | 2011 | |
|---|---|---|---|---|---|
| Profit share | 28.1 | 27.9 | 28.2 | 28.5 | |
| Investment ratio | 20.3 | 20.2 | 20.2 | 20.1 | |
| Savings ratio | 13.1 | 13.1 | 13.6 | 13.5 | |
| Self-financing ratio | 64.2 | 64.9 | 67.2 | 66.9 |
Investment weakened
Total GFCF slightly decreased in Q3 (–0.2% after +0.5%). Private non-financial corporations investment decreased by 0.4% (after a 0.6% increase). In particular in transport equipment it declined (–2.8% after +0.5%), similarly in information and communication (–1.5% after +1.5%). Public administrations’ investment slowed down (+0.1% after 1.0%), markedly so in public works. Household GFCF held steady for the second consecutive quarter (–0.1% after 0.0%).
Foreign trade of transport equipment proved dynamic
Exports went on growing in Q3 (+0.5%) mainly driven on by the upturn of transport equipment sales (+7.4% after –0.7%), in particular by the exceptional sales in aeronautics and aerospace. Meanwhile, imports stepped back (–0.6% after +1.6%) with the downturn of transport equipment imports (–6.8% after +8.6%). Consequently, the foreign trade balance improved and contributed +0.3 percentage point to GDP growth (after –0.4 point), +0.6 point of which are due to transport equipment.
Changes in inventories weighed down activity
Changes in inventories contributed –0.3 percentage point to GDP growth this quarter. Much of this contribution is imputable to transport equipment (contribution of –0.5 point). For these products, changes in inventory compensated the effects of the foreign trade.
Q2 GDP evolution is scaled down
GDP fell by –0.1% in 2012 Q2 and revised from a previously estimated stability (0.0%). This is the result of small revisions of the indicators, mainly those related to production of goods.
Pour en savoir plus
Time series : Operations on goods and services
Time series : Gross domestic product balance
Time series : Institutional sector accounts
Time series : Branch accounts