


 29 April 2013
2013- n° 101In February 2013, the turnover in manufacturing industry rose by 0.6% compared to
January Turnover in industry and construction - February 2013
29 April 2013
2013- n° 101In February 2013, the turnover in manufacturing industry rose by 0.6% compared to
January Turnover in industry and construction - February 2013
In February 2013, the turnover increased slightly in the manufacturing industry (+0.6%), after a fall in January. Exports remained stable (0.0%). In January 2013, the turnover of industry as a whole also went up by 0.6%.

Every index in this issue is in value, seasonally and working-day adjusted.
In February 2013, the turnover increased slightly in the manufacturing industry (+0.6%), after a fall in January. Exports remained stable (0.0%).
In January 2013, the turnover of industry as a whole also went up by 0.6%.
Stability over the last three months…
Over the quarter (q-o-q), the turnover seemed to remain stable in the manufacturing industry (+0.1%). It improved in other industries (+1.1%) and in the manufacture of food products and beverages (+2.1%). On the other hand, it fell sharply in the manufacture transport equipments (–3.6%) and in the manufacture of coke and refined petroleum products (–3.1%).
…and decline over the last year
Year-on-year, the turnover decreased in the manufacturing industry (–0.6%). It fell considerably in the manufacture of transport equipment (–5.8%) and in the manufacture of coke and refined petroleum (–4.5%). Conversely, it rose sharply in the manufacture of food products and beverages (+5.0%).
graphiqueIRgraph3 – Turnover in manufacturing industry
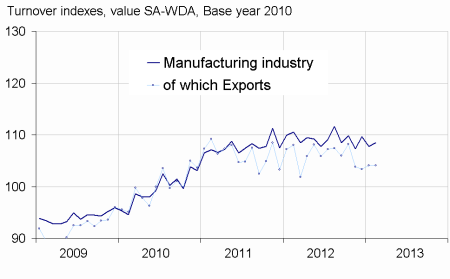
- Source: Insee
In February 2013, the turnover rebounded in the manufacture of transport equipment (+4.0%), mainly in the manufacture of other transport equipments (+6.8%). The turnover rose in the manufacture of coke and refined petroleum (+1.8%) and slightly in the electrical and electronic equipment; machine equipment (+0.7%). It remained stable in other industries (–0.1%) despite a substantial fall in the manufacture of chemicals and chemical products (–1.2%). On the other hand, it fell slightly in the manufacture of food products and beverages (–0.2%).
tableauIRtab5 – Variation of the turnover in industry and construction
| Nace Classification | Change in % | ||||
|---|---|---|---|---|---|
| Sectors | Weight** | Feb./ Jan. | Jan./ Dec. | q-o-q (1) | y-o-y (2) |
| BE : INDUSTRY | 10000 | 0.6 | –1.5 | 0.3 | 0.6 |
| CZ : MANUFACTURING | 8373 | 0.6 | –1.6 | 0.1 | –0.6 |
| Of which Exports | 2731 | 0.0 | 0.7 | –2.0 | –2.2 |
| (C1): Manufacture of food products and beverages | 1647 | –0.2 | 0.5 | 2.1 | 5.0 |
| (C2): Manufacture of coke and refined petroleum products | 478 | 1.8 | 3.9 | –3.1 | –4.5 |
| (C3): Electrical and electronic equipment; machine equipment | 1005 | 0.7 | 0.2 | 0.1 | –0.8 |
| (C4): Manufacture of transport equipment | 1428 | 4.0 | –7.6 | –3.6 | –5.8 |
| (C5): Other manufacturing | 3815 | –0.1 | –1.8 | 1.1 | –0.5 |
| DE: Mining and quarrying; energy; water supply; waste management | 1627 | 0.3 | –1.4 | 1.2 | 7.0 |
| FZ: CONSTRUCTION | 10000 | –0.3 | 1.6 | 0.4 | –1.6 |
- ** 10000=B..E and F
- (1) Quarter-on-quarter: last three months / three previous months
- (2) Year-on-year : last three months / three same months of previous year
- The codes correspond to different levels of aggregation of the NACE classification.
- Source: INSEE
Documentation
Methodology (pdf,140 Ko)
Pour en savoir plus
Time series : Turnover indices (VAT)
