


 28 February 2013
2013- n° 50Services Producer Price Indices : contrasting trends in the fourth quarter of 2012 Services producer price indices - 4th quarter 2012
28 February 2013
2013- n° 50Services Producer Price Indices : contrasting trends in the fourth quarter of 2012 Services producer price indices - 4th quarter 2012
Business services had rather mixed price trends in the fourth quarter of 2012. Prices for professional, scientific and technical services rose whereas they kept falling for information, communication as for administrative and support services.
Business services had rather mixed price trends in the fourth quarter of 2012. Prices for professional, scientific and technical services rose whereas they kept falling for information, communication as for administrative and support services.
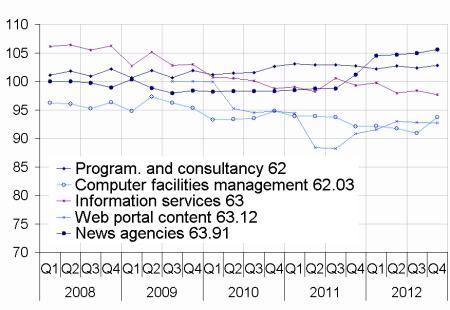
The drop in prices of information and communication services continued
The downward trend of prices for telecommunications and information services went on, with respectively -3.3% and -1.6% year-over-year. Prices for edition services fell this quarter (-1.0%), especially for software (-1.4%).
A slight decline in real estate services prices
Real estate services prices decreased slightly this quarter (-0.5%).
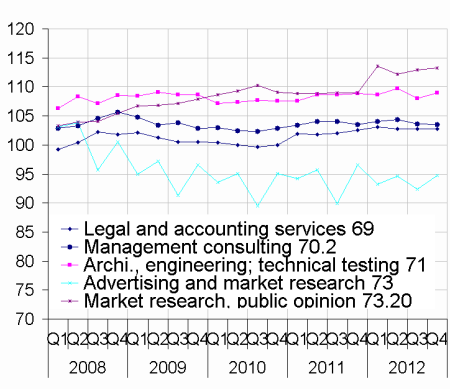
A sharp rise in prices of professional , scientific and technical services
Prices of advertising and market research, as well as architectural, engineering and technical testing grew significantly this quarter (+2.5% and +0.9% respectively).
Increased prices in administrative and support services
Prices for employment services increased again (+0.8%). This trend also appeared in the security prices (+0.5% in this quarter and +3.0% year-over-year). Prices for rental of personal and household goods and for rental of other machines fell this quarter.
New series are published :
Media representation services 73.12
Rental and leasing services of personal and household goods 77.2
Rental and leasing services of recreational and sports goods 77.21
Photocopying, document preparation and other specialised office support services 82.19
Call centre services in France 82.20
Call centre services offshore 82.20
tableautableau1 – Services Producer Price Indices : French market
| Divisions and groups in CPA rev. 2, 2008 | Weights (M €) | Indices Q4* 2012 | Changes in % | ||
|---|---|---|---|---|---|
| Q/ Q-1 | Q/ Q-4 | ||||
| 38.1 & 38.2 (6) | Waste collection, treatment and disposal | 21 252 | 103.2 | 1.2 | 2.9 |
| 53.20 (1) | Other postal and courier services | 555 | 96.9 | –1.2 | –3.1 |
| Information and communication | |||||
| 58 (8) | Publishing services | 24 985 | 102.8 | –1.0 | 0.5 |
| 61 (4) | Telecommunications | 12 650 | 83.3 | –0.5 | –3.3 |
| 62 (1) | Computer programming, consultancy and related services | 45 118 | 102.8 | 0.5 | –0.1 |
| 63 (8) | Information services | 10 204 | 97.7 | –0.7 | –2.8 |
| Real estate services | |||||
| 68.3 (8) | Real estate services on a fee or contract basis | 11 632 | 103.1 | –0.5 | –0.2 |
| Professional, scientific and technical services | |||||
| 69 (8) | Legal and accounting services | 32 514 | 102.8 | 0.0 | 0.8 |
| 70.2 (1) | Management consulting | 22 565 | 103.5 | –0.1 | –0.6 |
| 71 (2) | Architectural and engineering services; technical testing and analysis services | 49 881 | 109.0 | 0.9 | 0.4 |
| 73 (3) | Advertising and market research | 19 960 | 94.7 | 2.5 | 5.3 |
| Administrative and support services | |||||
| 77.1 (5) | Rental of motor vehicles | 8 121 | 109.1 | 0.3 | –0.5 |
| 77.3 (8) | Rental of other machinery, equipment and tangible goods | 18 064 | 102.2 | –1.0 | –0.1 |
| 78 (7) | Employment services | 28 623 | 106.2 | 0.8 | 2.5 |
| 80 (1) | Security | 6 581 | 116.3 | 0.5 | 3.2 |
| 81 (7) | Services to buildings and landscape | 19 826 | 102.8 | 0.2 | 2.5 |
| 82.20 (5) | Call centres | 4 864 | 102.2 | –0.7 | –1.5 |
- u : unavailable s : statistical secret
- *: Telecommunications prices are known with one quarter delay.
- Source : INSEE, "Observation des prix de l'industrie et des services aux entreprises" survey
graphiquegraph2_telecom_A – Publishing and telecommunications

graphiquegraph6_pro_A – Professional, scientific and technical services
graphiquegraph3_loc_A – Rental and leasing services

graphiquegraph1_info_A – Computer programming and information
graphiquegraph5_immo_A – Real estate

graphiquegraph4_emploi_A – Employment services

Documentation
Simplified methodology (pdf,134 Ko)
Pour en savoir plus
Time series : Services producer price indices
