


 13 December 2013
2013- n° 287In Q3 2013, the labor cost index-total labor costs decreased sharply Labor cost index in industry, construction and services - 3rd Quarter 2013
13 December 2013
2013- n° 287In Q3 2013, the labor cost index-total labor costs decreased sharply Labor cost index in industry, construction and services - 3rd Quarter 2013
In the third quarter of 2013, the labor cost index (LCI) - wages & salaries for the business economy slowed down (+0.2%) in seasonally adjusted data. In the second quarter of 2013 the index had increased by 1.0%. In year-on-year changes, the LCI - wages & salaries increased by 2.0%. Hours worked slightly decreased (-0.1% in year-on-year changes).
Warning: Since the Q1 2013, the tax credit for encouraging competitiveness and jobs (CICE) was included in the calculation of the labor cost index as a subsidy received by the employer. In Q3 2013, for business economy (excluding agriculture), the year-on-year changes of the labor cost index – total labor cost (+0.5%) is 1.8 points lower than what it would have been without CICE (+2.3%). The LCI – wages & salaries is not impacted.
The labor cost index - wages & salaries
In the third quarter of 2013, the labor cost index (LCI) - wages & salaries for the business economy slowed down (+0.2%) in seasonally adjusted data. In the second quarter of 2013 the index had increased by 1.0%. In year-on-year changes, the LCI - wages & salaries increased by 2.0%. Hours worked slightly decreased (-0.1% in year-on-year changes).
graphiqueGraphSSangl – LCI - wages & salaries : Year-on-year changes
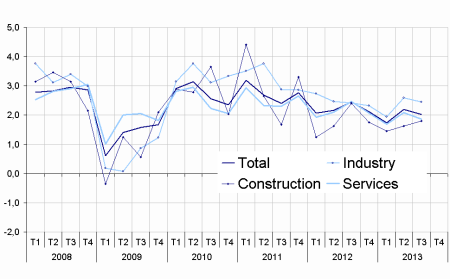
Wages decreased in industry but sped up in construction
Wages decreased by 0.2% in industry after +1.3% in the second quarter 2013. Particularly, they remained stable in the manufacturing sector (+0.1% after +1.2%). In year-on-year changes, wages rised by 2.5% in industry. In the construction sector, they increased in the third quarter 2013 (+0.8% after +0.5%). In year on year changes, they slightly improved : +1.8% after +1.6%.
Wages slowed down in services
Wages decreased by 0.3% in services in the third quarter 2013 after +0.9%. They slowed down especially in financial activities (+0.3% after +1.6%), and decreased in administrative and support service activities : -0.4% after +1.9%. However, they sped up in information and communication (+0.9% after +0.4%). In year on year changes, wages slightly slowed down in services (+1.9% after +2.1%).
tableauTableau 1 – LCI - wages & salaries
| Quarterly changes (%) | Annual changes (%) | |||
|---|---|---|---|---|
| Q2-13 | Q3-13 | Q2-13 | Q3-13 | |
| Industry | 1.3 | -0.2 | 2.6 | 2.5 |
| Mining and quarrying | -0.1 | 1.0 | 1.7 | 2.7 |
| Manufacturing | 1.2 | 0.1 | 2.7 | 2.7 |
| Electricity, gas, steam and air conditioning supply | 2.9 | -4.1 | 1.2 | -0.2 |
| Water supply; sewerage, waste management and remediation activities | 0.8 | 0.1 | 1.9 | 1.1 |
| Services | 0.9 | 0.3 | 2.1 | 1.9 |
| Wholesale and retail trade; repair of motor vehicles and motorcycles | 0.9 | 0.3 | 1.9 | 1.7 |
| Transportation and storage | 0.4 | 0.2 | 1.6 | 1.8 |
| Accommodation and food service activities | 0.9 | 0.8 | 1.8 | 2.0 |
| Information and communication | 0.4 | 0.9 | 1.3 | 1.6 |
| Financial and insurance activities | 1.6 | 0.3 | 2.0 | 2.1 |
| Real estate activities | 0.6 | 0.0 | 2.3 | 1.9 |
| Professional, scientific and technical activities | 0.7 | 0.1 | 1.9 | 1.3 |
| Administrative and support service activities | 1.9 | -0.4 | 3.0 | 1.8 |
| Construction | 0.5 | 0.8 | 1.6 | 1.8 |
| TOTAL | 1.0 | 0.2 | 2.2 | 2.0 |
- Sources: Acoss, Dares, Insee
The index of the second quarter 2013 is not revised
The evolution of wages in the second quarter of 2013 is not revised this quarter.
The labor cost index – total labor cost
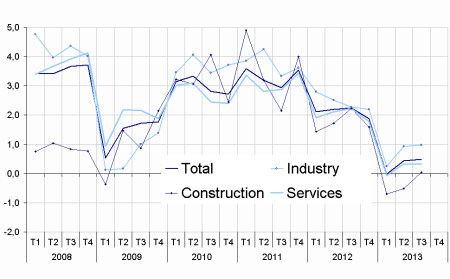
From the 1st January of 2013, date where it was implemented, the tax credit for encouraging competitiveness and jobs (CICE) is taken into account in the calculation of the LCI – total labor cost as a subsidy received by the employer. In the third quarter of 2013, when incorporating the CICE, the labor cost index (LCI) – total labor cost for the business economy increased by 0.3% (seasonally adjusted data) after +1.1% in the second quarter of 2013.
In year-on-year changes, the labor cost index (LCI) – total labor cost slightly increased (+0.5%). Without the CICE, it would have increased by 2.3% in year on year changes.
graphiqueGraphSCangl – LCI - total labor cost: Year-on-year changes
Small revision of the index of the first quarter 2013
The evolution of the labor cost index (LCI) – total labor cost in the second quarter of 2013 is revised downward by 0.1 point in year on year changes and remained unchanged in quarterly changes.
tableauTableau 8 – LCI - total labor cost
| Quarterly changes (%) | Annual changes(%) | |||
|---|---|---|---|---|
| Q2-13 | Q3-13 | Q2-13 | Q3-13 | |
| Industry | 1,4 | –0,2 | 0,9 | 1,0 |
| Mining and quarrying | 0,0 | 1,1 | –0,2 | 1,0 |
| Manufacturing | 1,3 | 0,2 | 0,9 | 1,1 |
| Electricity, gas, steam and air conditioning supply | 2,9 | –4,0 | 0,1 | –1,1 |
| Water supply; sewerage, waste management and remediation activities | 0,9 | 0,3 | –0,1 | –0,7 |
| Services | 1,1 | 0,4 | 0,3 | 0,3 |
| Wholesale and retail trade; repair of motor vehicles and motorcycles | 1,2 | 0,5 | –0,1 | 0,0 |
| Transportation and storage | 0,4 | 0,3 | –0,5 | 0,0 |
| Accommodation and food service activities | 1,2 | 1,2 | –0,8 | –0,2 |
| Information and communication | 0,4 | 1,0 | 0,3 | 0,7 |
| Financial and insurance activities | 1,7 | 0,4 | 1,1 | 1,3 |
| Real estate activities | 0,9 | 0,1 | 0,6 | 0,5 |
| Professional, scientific and technical activities | 0,7 | 0,2 | 0,6 | 0,2 |
| Administrative and support service activities | 2,1 | –0,4 | 0,5 | –0,5 |
| Construction | 0,6 | 1,1 | –0,5 | 0,0 |
| TOTAL | 1,1 | 0,3 | 0,4 | 0,5 |
- Sources: Acoss, Dares, Insee
tableauTableau 9 – LCI - total labor cost without CICE
| Quarterly changes (%) | Annual changes (%) | |||
|---|---|---|---|---|
| Q2-13 | Q3-13 | Q2-13 | Q3-13 | |
| Industry | 1,4 | –0,2 | 2,7 | 2,7 |
| Mining and quarrying | 0,0 | 1,1 | 1,8 | 3,0 |
| Manufacturing | 1,3 | 0,2 | 2,7 | 2,9 |
| Electricity, Gas, steam and air conditioning supply | 2,9 | –4,0 | 1,1 | –0,1 |
| Water supply; sewerage, waste management and remediation activities | 0,9 | 0,3 | 1,9 | 1,3 |
| Services | 1,1 | 0,4 | 2,1 | 2,1 |
| Wholesale and retail trade; repair of motor vehicles and motorcycles | 1,2 | 0,5 | 2,0 | 2,0 |
| Transportation and storage | 0,4 | 0,3 | 1,5 | 2,0 |
| Accommodation and food service activities | 1,2 | 1,2 | 1,9 | 2,5 |
| Information and communication | 0,4 | 1,0 | 1,3 | 1,7 |
| Financial and insurance activities | 1,7 | 0,4 | 2,0 | 2,2 |
| Real estate activities | 0,9 | 0,1 | 2,4 | 2,2 |
| Professional, scientific and technical activities | 0,7 | 0,2 | 1,9 | 1,4 |
| Administrative and support service activities | 2,1 | –0,4 | 3,0 | 2,0 |
| Construction | 0,6 | 1,1 | 1,8 | 2,3 |
| TOTAL | 1,1 | 0,3 | 2,2 | 2,3 |
- Sources: Acoss, Dares, Insee
Pour en savoir plus
