


 30 September 2013
2013- n° 225Overall producer prices of agricultural products decreased in August Indices of agricultural prices - August 2013
30 September 2013
2013- n° 225Overall producer prices of agricultural products decreased in August Indices of agricultural prices - August 2013
In August 2013, overall producer prices of agricultural products decreased by 2.0 % compared to July ; over one year they dropped by 1.0%.
In August 2013, overall producer prices of agricultural products decreased by 2.0 % compared to July ; over one year they dropped by 1.0%.
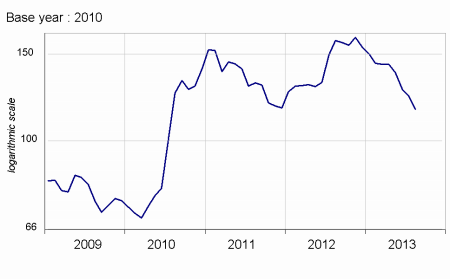
Cereal prices continued to drop in August (–5.8 %), as a result of record harvests in the Northern hemisphere.
graphiquecereal – Production prices of cereals
Oleaginous prices noticeably went down this month (–9.6 %). The Ukrainian competition strongly weighed down on sunflower prices while significant harvests of rape were expected in Canada.
Wine prices slightly decreased in August compared to July (-0.7 %), but stayed at a high level year-over-year (+12.4%). The prices for some PDO wines were sustained by the export demand. The less significant crop last autumn explained the rise of other wines prices over a year.
Fresh fruits prices surged year-over-year (+22.0 %). The peaches and the plum became more expensive. Bad weather conditions had decreased their yields while Spanish peaches did not congest the supply. Moreover, the demand for these two fruits was sustained by the hot weather in August. The early varieties of apple easily sold through export, as the supply was limited at the European scale. Conversely, the pear, whose prices stagnated, was more affected by the competition of Italy and Spain.
graphiquevegetable – Production prices of fresh vegetables
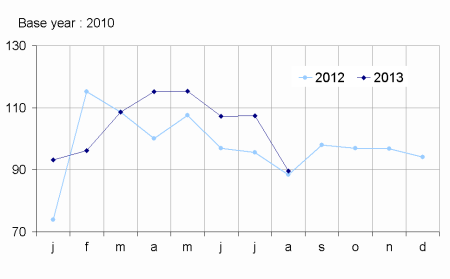
Fresh vegetables prices did not change much year-over-year (+1.4 %). On the supply side, the production of melons, delayed by a dull weather, arrived massively this month. Garlic prices tumbled due to the foreign competition. On the demand side, consumers turned away a little from stalls of tomatoes, partly falling back on the production from family gardens. The commercial demand stayed strong for cucumbers and courgettes.
graphiquepig – Production prices of pigs and big cattle
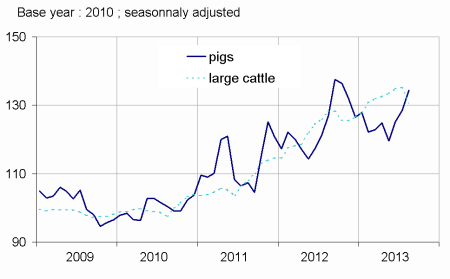
On a seasonally adjusted basis, animals prices dropped in August (-0.6 %). Big cattle prices decreased due to a sluggish demand. On the other hand, pig prices noticeably increased : the supply hardly kept up with the demand at the European level. Egg prices dipped again in August, with the production staying at a high level.
tableauTab1 – Indices of producer prices of agricultural products (IPPAP)
| Variation as % over | |||||
|---|---|---|---|---|---|
| weights | August 2013 | a month | 3 month | a year | |
| raw | Seasonally adjusted data | raw | |||
| Agricultural goods output | 1000 | 120.5 | –2.0 | –4.0 | –1.0 |
| excluding fruits and vegetables | 900 | 122.1 | –1.6 | –3.4 | –1.8 |
| Crop output (excluding fruits and vegetables) | 502 | 120.5 | –2.5 | –7.4 | –6.7 |
| Cereals | 190 | 116.0 | –5.8 | –15.6 | –27.4 |
| of which soft wheat | 113 | 111.4 | –4.3 | –20.0 | –29.8 |
| grain maize | 42 | 117.7 | –11.5 | –10.7 | –24.8 |
| Potatoes | 26 | 236.5 | /// | /// | +160.0 |
| Wines | 171 | 118.6 | –0.7 | +0.3 | +12.4 |
| Protected designation of origine | 135 | 118.0 | –0.3 | +0.8 | +12.0 |
| other wines | 36 | 120.6 | –2.5 | –1.6 | +14.0 |
| Oleaginous | 49 | 96.6 | –9.6 | –21.6 | –30.6 |
| Horticultural products | 31 | 104.9 | +0.9 | –0.1 | +4.1 |
| Other crop products | 34 | 116.6 | –0.7 | –0.4 | –0.7 |
| Fruits and vegetables (1) | 100 | 104.5 | /// | /// | +9.8 |
| Fresh vegetables | 51 | 89.6 | /// | /// | +1.4 |
| Fresh fruits | 41 | 126.0 | /// | /// | +22.0 |
| Animal output | 398 | 124.2 | –0.5 | +2.3 | +4.9 |
| Animals | 234 | 127.2 | –0.6 | +1.7 | +3.3 |
| of which large cattle | 96 | 131.2 | –3.5 | –1.6 | +1.7 |
| calves | 26 | 104.9 | –1.6 | –4.4 | –1.5 |
| pigs | 54 | 138.7 | +4.6 | +12.4 | +5.9 |
| sheep | 10 | 120.4 | +0.1 | +6.8 | +14.2 |
| poultry | 44 | 120.9 | –0.4 | –1.7 | +3.8 |
| of which chicken | 18 | 122.4 | –0.4 | –1.5 | +3.8 |
| Milk | 149 | 122.5 | 0.0 | +3.9 | +13.1 |
| of which cow milk (2) | 139 | 123.9 | 0.0 | +4.1 | +13.6 |
| Eggs | 15 | 93.7 | –2.1 | –2.8 | –34.9 |
- (1) Including vegetables for industry.
- (2) The price for August is not yet known and therefore is estimated by carrying forward the seasonally adjusted price from July
- Sources: INSEE - SSP (Ministry of Agriculture)
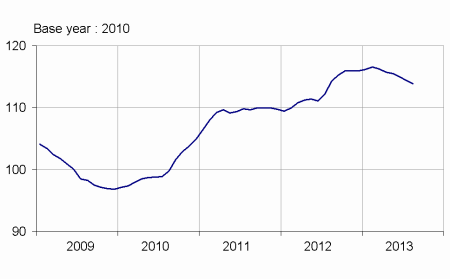
Purchase prices of the means of agricultural production decreased in August.
The prices of intermediate consumptions continued to decrease in August (-0.5 %). Prices for fertilisers and for animal feeds dropped, whereas those of energy rose. Investment prices were almost stable (+0.1 %).
graphiquemeans – Purchase price of the means of agricultural production
tableauTab2 – Indices of purchase prices of the means of agricultural production (IPAMPA)
| weights | August 2013 | Variation as % over | |||
|---|---|---|---|---|---|
| a month | 3 month | a year | |||
| Total input | 1000 | 114.1 | –0.4 | –1.2 | –0.1 |
| Intermediate consumptions | 755 | 116.8 | –0.5 | –1.6 | –0.7 |
| Energy (1) | 102 | 120.8 | +1.5 | +3.1 | –3.7 |
| Seeds | 67 | 108.4 | +0.3 | 0.0 | +4.5 |
| Fertilisers and soil improvers | 100 | 119.6 | –0.9 | –7.1 | –7.0 |
| Plant protection products | 83 | 101.0 | –0.2 | +0.1 | +0.3 |
| Animal feed | 211 | 131.4 | –1.8 | –3.4 | +0.2 |
| Veterinary expenses | 50 | 109.1 | +0.1 | +0.5 | +3.1 |
| Small equipment and tools | 16 | 109.4 | +0.1 | +0.9 | +2.6 |
| Maintenance of materials | 65 | 108.8 | 0.0 | +0.4 | +2.3 |
| Maintenance of buildings | 9 | 106.7 | –0.1 | –0.3 | +0.6 |
| Other goods and services | 52 | 102.3 | 0.0 | +0.1 | +0.5 |
| Goods and services contributing to investment | 245 | 105.9 | +0.1 | +0.2 | +1.8 |
| Material | 193 | 105.6 | +0.3 | +0.5 | +2.3 |
| Tractors | 82 | 105.5 | +0.1 | 0.0 | +1.3 |
| Machinery and plant for cultivation | 37 | 106.5 | +1.1 | +1.9 | +4.6 |
| Machinery and plant for harvesting | 43 | 106.3 | 0.0 | +0.5 | +2.4 |
| Utility vehicles | 19 | 103.0 | –0.1 | +0.5 | +0.7 |
| Buildings | 52 | 106.7 | –0.6 | –1.2 | –0.1 |
- (1) The repayment of the domestic tax on energy products (TICPE) benefiting farmers has been applied in advance for the year 2013
- Sources: INSEE - SSP (Ministry of Agriculture)
Documentation
Methodology (pdf,122 Ko)
Pour en savoir plus
Time series : Indices of agricultural prices
