


 17 January 2014
2014- n° 13In December 2013, slight increase in oil prices Prices of oil and raw material imports - December 2013
17 January 2014
2014- n° 13In December 2013, slight increase in oil prices Prices of oil and raw material imports - December 2013
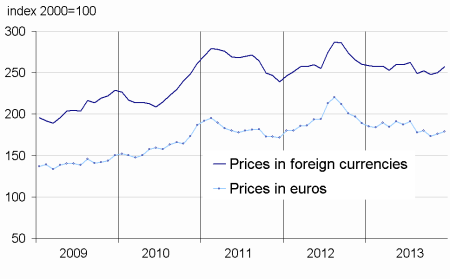
In December, the price of crude oil in euro terms marked a moderate increase (+1.1%) at €80.7 per barrel of Brent. On the contrary, prices of imported commodities except energy in euros went down slightly (-0.4%), due to a downturn in industrial raw materials prices (-1.5%).
In December, the price of crude oil in euro terms marked a moderate increase (+1.1%) at €80.7 per barrel of Brent. On the contrary, prices of imported commodities except energy in euros went down slightly (-0.4%), due to a downturn in industrial raw materials prices (-1.5%).
Slight hike in oil prices in euros
In December, the price of crude oil from the North Sea (Brent) in dollars increased slightly (+2.8% after -1.5%): the still strung-up geopolitical backdrop along with the clear drop in supply from the OPEC countries ( to its lowest level in December since May 2011) kept the barrel price high ($110.7 on average). In euros, the rise in the Brent price was less marked (+1.1% from –0.4%) due to a slight appreciation of the euro against the dollar (+1.6%).
Slight decline in industrial raw materials prices
In December, prices of industrial raw materials in euros came down slightly (-1.5% after +0.8% in November). Mineral raw materials prices kept falling (-1.2% after –0.1%) like those of precious metals (-5.9% from -1.7%) including silver prices (-7.1% after -4.2%) and platinium (-5.7% after –1.5%). Prices of non-ferrous metals dipped as well (-0.5% after –1.2%), in particular those of aluminium (-2.2% after –2.4%) whose inventories were still high. By contrast, the price of zinc increased (+4.2% after +0.2%), buoyed up by a substantial global demand.
Prices of agricultural raw materials also dropped (-2.3% after +3.6%) led by a dip in wood pulp prices (-0.5% from +2.9%) and a sharp decline in those of sawn softwood (-6.1% after +7.2%).
Slight rise in raw food materials prices
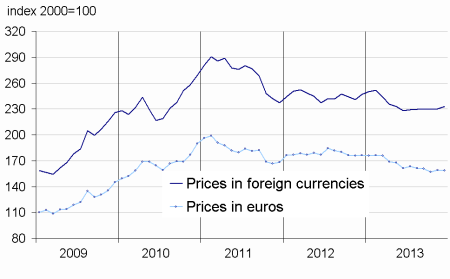
In December, prices of raw food materials in euros increased slightly (+1.4% after +1.9%). The price of soybean meal rose significantly (+8.3% after +4.0%), especially due to an epidemic in soybean crop areas in Brazil that caused losses in output. Prices of tropical foodstuffs went up as well (+2.6% on average) and particularly those of robusta (+9.5% after –3.8/%). On the contrary, prices of cereals tended to fall due to plentiful crops, including those of corn (–0.7%) and rice (–1.8%) along with vegetable oil prices that also dropped (-3.4%).
tableautabpetrole – Oil and petroleum products
| Prices | Change (%) | |||
|---|---|---|---|---|
| of last month | over the last month | over the last 3 months | over the last 12 months | |
| Brent in $ per barrel | 110,7 | 2,8 | –0,8 | 1,3 |
| Brent in € per barrel | 80,7 | 1,1 | –3,3 | –3,0 |
| Gasoline €/L | 0,48 | 2,3 | –9,1 | –12,8 |
| Gas Oil | 684,6 | 0,9 | –2,5 | –2,9 |
| Heavy fuel | 443,3 | 0,0 | –3,5 | –3,6 |
| Naphtha | 696,9 | 1,3 | 0,2 | –2,8 |
- Prices are in euros per tonne unless otherwise specified
- Source : INSEE
tableautabmatprem – Imported raw materials (excluding energy) in euros
| Index | Changes (%) | |||
|---|---|---|---|---|
| over the last month | over the last 3 months | over the last 12 months | ||
| Food total | 178,9 | 1,4 | –0,5 | –5,4 |
| Tropical foodstuffs | 148,3 | 2,6 | 2,6 | –3,7 |
| Oil seeds, vegetable oils | 235,9 | 3,3 | –2,5 | –3,2 |
| Cereals | 145,9 | –1,5 | –8,4 | –31,4 |
| Sugar | 134,0 | –9,0 | –6,2 | –18,2 |
| Beef meat | 117,1 | –1,1 | 3,8 | 3,7 |
| Industrial raw materials | 156,9 | –1,5 | –1,9 | –12,8 |
| Agricultural raw materials | 105,9 | –2,3 | 0,6 | –4,4 |
| Natural Fibers | 120,9 | 1,3 | –5,0 | –1,2 |
| Natural rubber | 240,3 | –0,7 | –6,9 | –23,0 |
| Hides | 88,3 | –2,1 | 12,2 | 6,7 |
| Wood pulp | 89,6 | –0,5 | 2,0 | 7,2 |
| Tropical wood | 99,6 | 0,1 | 0,6 | –2,9 |
| Sawn softwood | 96,0 | –6,1 | 2,3 | –5,7 |
| Minerals | 184,6 | –1,2 | –2,7 | –15,2 |
| Iron ore | 733,3 | –2,0 | –1,4 | 0,9 |
| Non-ferrous metals | 138,1 | –0,5 | –2,1 | –17,4 |
| Precious metals | 212,4 | –5,9 | –11,5 | –30,4 |
| All commodities | 158,5 | –0,4 | –1,3 | –10,1 |
- Source : INSEE
graphiqueG_petrole_ang – Oil
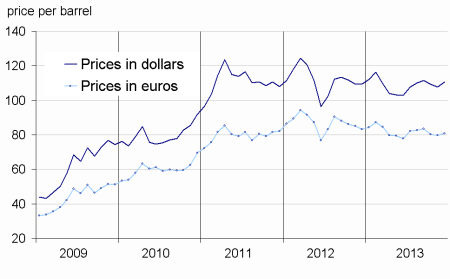
- Source : Insee
graphiqueG_alim_ang – Food
- Source : Insee
graphiqueG_ensemble_ang – All commodities
- Source : Insee
graphiqueG_indus_ang – Industrial raw materials
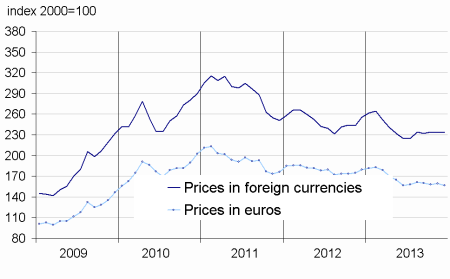
- Source : Insee
Pour en savoir plus
Time series : Raw materials prices
