


 16 May 2014
2014- n° 114In April 2014, oil prices levelled off Prices of oil and raw material imports - April 2014
16 May 2014
2014- n° 114In April 2014, oil prices levelled off Prices of oil and raw material imports - April 2014
In April, the price of crude oil in euro terms was almost stable (+0.2%) and stood at €78.2 on average per barrel of Brent. Prices of imported commodities except energy in euros increased slightly (+0.6%), despite a higher rise in prices of industrial raw materials (+1.7%). This stemmed from a climb in minerals (+3.2%).
In April, the price of crude oil in euro terms was almost stable (+0.2%) and stood at €78.2 on average per barrel of Brent. Prices of imported commodities except energy in euros increased slightly (+0.6%), despite a higher rise in prices of industrial raw materials (+1.7%). This stemmed from a climb in minerals (+3.2%).
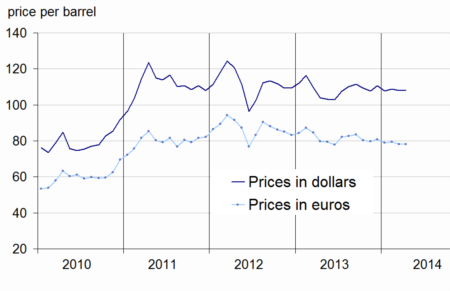
Stability in oil prices in euros
In April, the price of crude oil from the North Sea (Brent) in dollars levelled out (+0.1% after -0.7%). The bullish effect of the geopolitical strained situation in Ukraine was especially offset by a supply improvement in Libya. In euros, the price of Brent was practically stable as well (+0.2% after -2.0%).
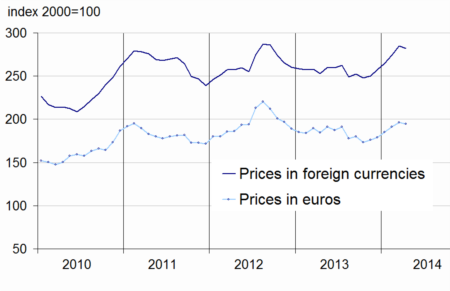
Industrial raw materials prices picked up
In April, prices of industrial raw materials in euros increased (+1.7% after -2.7% in March). Prices of agricultural raw materials were still on the downside (-2.4% after -0.9%), especially those of Natural rubber (-6.4% after –0.4%) as a result of an increasing worldwide surplus. Those of Sawn softwood declined again (-6.8% from -1.6%). By contrast, prices of Minerals climbed (+3.2% after -3.4%). Iron ore prices recovered (+2.6% after –9.0%). Prices of Non-ferrous metals rebounded as well (+3.9% from -2.2%), in particular those of aluminum (+6.4% after -0.6%), on account of a weakening market surplus. Copper prices held steady (+0.1% after -7.8%). Prices of Precious metals declined (-2.5% from +0.9%), especially those of gold (–2.7% from +1.5%), in a decreasing risk aversion backdrop.
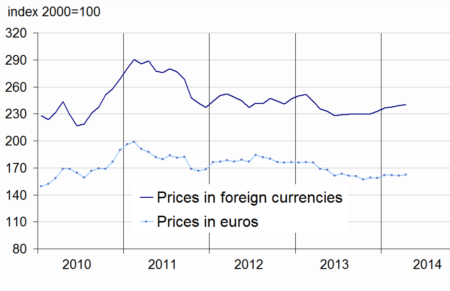
Drop in raw food materials prices
In April, prices of raw food materials in euros decreased (–0.8% after +2.6%). Most notably, prices of Cereals dipped (–1.8% after -0.1%), even though those of maize rose (+4.2% after +6.6%), on account of lower-than-expected American inventories. Prices of Beef meat dipped sharply (-6.5% after +8.4%). Those of Sugar went down too (-3.2% from +6.9%) due to a high output. The rise in Arabica prices continued (+4.8% after +21.4%), as a result of a drought that hit Brazilian crops.
tableautabpetrole – Oil and petroleum products
| Prices | Change (%) | |||
|---|---|---|---|---|
| of last month | over the last month | over the last 3 months | over the last 12 months | |
| Brent in $ per barrel | 108,0 | 0,1 | 0,4 | 4,0 |
| Brent in € per barrel | 78,2 | 0,2 | –1,0 | –1,9 |
| Gasoline €/L | 0,55 | 5,4 | 12,0 | –0,1 |
| Gas Oil | 657,1 | 0,7 | –2,1 | –1,0 |
| Heavy fuel | 449,0 | –3,1 | 3,5 | –0,9 |
| Naphtha | 670,6 | 1,9 | –1,6 | 6,6 |
- Prices are in euros per tonne unless otherwise specified
- Source : INSEE
tableautabmatprem – Imported raw materials (excluding energy) in euros
| Index | Changes (%) | |||
|---|---|---|---|---|
| over the last month | over the last 3 months | over the last 12 months | ||
| Food total | 194,5 | –0,8 | 5,1 | 5,3 |
| Tropical foodstuffs | 175,3 | 0,5 | 14,1 | 19,3 |
| Oil seeds, vegetable oils | 244,7 | 2,0 | 4,8 | 4,3 |
| Cereals | 145,0 | –1,8 | 0,4 | –28,9 |
| Sugar | 137,8 | –3,2 | 8,8 | –9,5 |
| Beef meat | 133,6 | –6,5 | –2,9 | 10,8 |
| Industrial raw materials | 154,2 | 1,7 | –3,0 | –9,5 |
| Agricultural raw materials | 103,0 | –2,4 | –5,0 | –6,8 |
| Natural Fibers | 127,2 | –2,3 | 1,3 | –5,2 |
| Natural rubber | 185,5 | –6,4 | –17,7 | –31,8 |
| Hides | 93,1 | 1,4 | 5,5 | 5,7 |
| Wood pulp | 90,7 | 0,5 | 0,1 | 3,4 |
| Tropical wood | 101,0 | 0,9 | 0,3 | 3,2 |
| Sawn softwood | 88,4 | –6,8 | –10,7 | –16,4 |
| Minerals | 181,9 | 3,2 | –2,2 | –10,4 |
| Iron ore | 614,2 | 2,6 | –11,8 | –21,3 |
| Non-ferrous metals | 141,1 | 3,9 | 0,4 | –6,7 |
| Precious metals | 222,6 | –2,5 | 1,0 | –16,5 |
| All commodities | 162,3 | 0,6 | 0,3 | –3,8 |
- Source : INSEE
graphiqueG_petrole_ang – Oil
- Source : Insee
graphiqueG_alim_ang – Food
- Source : Insee
graphiqueG_ensemble_ang – All commodities
- Source : Insee
graphiqueG_indus_ang – Industrial raw materials

- Source : Insee
Pour en savoir plus
Time series : Raw materials prices
