


 29 March 2013
2013- n° 76Overall producer prices of agricultural products decreased in February Indices of agricultural prices - february 2013
29 March 2013
2013- n° 76Overall producer prices of agricultural products decreased in February Indices of agricultural prices - february 2013
In February, overall producer prices decreased ( 1.1 % compared to January) ; over one year they increased by 6.2 %.
In February, overall producer prices decreased (–1.1 % compared to January) ; over one year they increased by 6.2 %.
Cereal prices went down in February (-4.4 %). Good weather in the United States and in Argentina weighed on the world prices. Moreover, significant export capacities for maïze in Brazil and Ukraine also contributed to the drop of the prices of this cereal.
graphiquecereal – Producer price of cereals
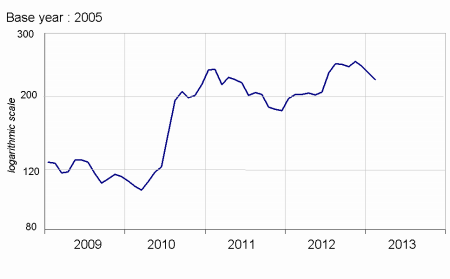
- Source : INSEE
Oleaginous prices remained stable at a high level this month. The global supply of rape was not abundant and the demand was contained.
Potato prices doubled in February compared to the same month last year (+96.1 %), due to a marked shortfall of supply in North-Western Europe. The bad weather in August spoiled practically a fifth of the crop in England and led as well to a substantial deficit of production in the Netherlands and in Belgium. The dry weather in France during September decreased the yields.
Wine prices did not change much in February (+0.2 %). Common wines, nevertheless, surged by 12.2 % over one year, the less significant crop this year having led to a decreasing production.
Price of fresh fruits went up strongly in February year-over-year (+47.4 %). Prices of apple and pear rose respectively by 51.6 % and 63.2 %, due to a considerable slump in production in Europe.
graphiquevegetable – Producer price of fresh vegetables
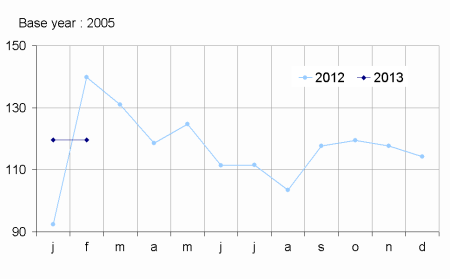
- Source : SSP (Ministry of Agriculture)
Fresh vegetables prices decreased year-over-year (–14.4 %), a move that was explained by the atypical pattern noted at the beginning of last year. Chicory and salades prices went down sharply due to a significant supply. On the other hand, onion prices has been rebounding since the beginning of the selling campaign as a result of decreasing quantities after the previous record harvest.
graphiquepig – Producer prices of pigs ans large cattle
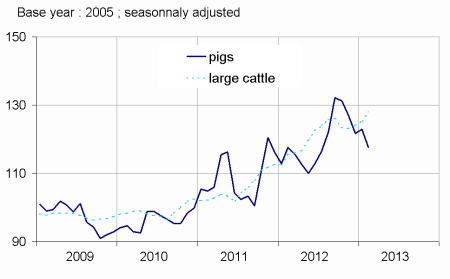
On a seasonally adjusted basis, price of animals remained globally stable in February (–0.2 %). Big cattle and calves prices rose as a result of decreasing livestocks. Pig prices dropped due to a tumble in the export demand this month. Egg prices kept on slumping (–8.8 %) after the production had rebounded.
tableauTab1 – Indices of producer prices of agricultural products (IPPAP)
| Variation as % over | |||||
|---|---|---|---|---|---|
| weights | Feb 2013 | a month | 3 month | a year | |
| raw | seasonally adjusted data | raw | |||
| Agricultural goods output | 1000 | 142.0 | –1.1 | –2.3 | +6.2 |
| excluding fruits and vegetables | 878 | 143.4 | –1.4 | –3.1 | +6.3 |
| Crop output (excluding fruits and vegetables) | 417 | 165.1 | –2.0 | –4.8 | +11.0 |
| Cereals | 115 | 220.3 | –4.4 | –11.6 | +10.6 |
| of which soft wheat | 63 | 238.5 | –3.3 | –10.9 | +15.7 |
| grain maize | 27 | 196.7 | –5.6 | –12.4 | +8.1 |
| Potatoes | 19 | 228.1 | /// | /// | +96.1 |
| Wines | 161 | 130.5 | +0.2 | +2.7 | +7.2 |
| quality wines | 140 | 127.7 | 0.4 | +2.4 | +6.3 |
| other wines | 21 | 147.7 | –0.6 | +4.1 | +12.2 |
| Oleaginous | 28 | 217.7 | 0.0 | –1.1 | +4.5 |
| Horticultural products | 51 | 135.0 | +0.3 | +1.5 | +0.2 |
| Other crop products | 43 | 115.5 | +0.6 | +0.2 | +10.7 |
| Fruits and vegetables (1) | 122 | 131.8 | /// | /// | +5.9 |
| Fresh vegetables | 61 | 119.7 | /// | /// | –14.4 |
| Fresh fruits | 39 | 156.9 | /// | /// | +47.4 |
| Animal output | 461 | 123.9 | –0.5 | –1.1 | +1.0 |
| Animals | 286 | 127.3 | –0.2 | +0.2 | +6.9 |
| of which large cattle | 108 | 127.2 | +2.0 | +3.8 | +10.8 |
| calves | 29 | 125.8 | +1.3 | +3.0 | +3.8 |
| pigs | 64 | 115.6 | –4.4 | –7.5 | 0.0 |
| sheep | 14 | 113.0 | –1.2 | –5.5 | –8.1 |
| poultry | 59 | 149.0 | –0.1 | +1.7 | +12.7 |
| of which chicken | 26 | 150.3 | –0.2 | +2.2 | +14.1 |
| Milk | 159 | 113.9 | 0.0 | –0.5 | –5.1 |
| of which cow milk (2) | 148 | 114.3 | +0.1 | –0.6 | –5.5 |
| Eggs | 13 | 174.2 | –8.8 | –20.8 | –23.5 |
- (1) Including vegetables for industry.
- (2) The price for February is not yet known and therefore is estimated by carrying forward the seasonally adjusted price from January
- Sources: INSEE - SSP (Ministry of Agriculture)
Purchase price of the means of agricultural production did not move much in February.
The prices of intermediate consumptions almost stabilised in February (+0.1 %), as well as investment prices (+0.1 %). Prices of animal feed increased more than 20 % over one year.
graphiquemeans – Purchase price of the means of agricultural production
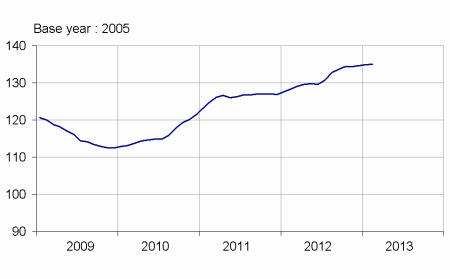
- Sources: INSEE - SSP (Ministry of Agriculture)
tableauTab2 – Indices of purchase prices of the means of agricultural production (IPAMPA)
| weights | Feb 2013 | Variation as % over | |||
|---|---|---|---|---|---|
| a month | 3 month | a year | |||
| Total input | 1000 | 135.0 | +0.1 | +0.5 | +5.1 |
| Goods and services currently consumed in agriculture | 758 | 139.5 | +0.1 | +0.4 | +6.2 |
| Energy | 84 | 162.8 | +0.9 | +1.6 | –0.1 |
| Seeds | 51 | 121.2 | +0.4 | +1.5 | +4.2 |
| Fertilisers and soil improvers | 92 | 167.1 | +0.1 | –0.2 | +0.8 |
| Plant protection products | 77 | 105.1 | +0.3 | –1.0 | +0.6 |
| Animal feed | 189 | 163.8 | –0.4 | –0.1 | +20.4 |
| Veterinary expenses | 38 | 120.7 | +0.5 | +1.7 | +3.3 |
| Small equipment and tools | 14 | 112.5 | –0.2 | –0.4 | +2.5 |
| Maintenance of materials | 56 | 132.2 | +0.3 | +1.1 | +3.4 |
| Maintenance of buildings | 9 | 124.3 | 0.0 | 0.0 | +0.5 |
| Other goods and services | 149 | 113.4 | –0.2 | +0.8 | +0.8 |
| Goods and services contributing to investment | 242 | 121.2 | +0.1 | +0.5 | +1.4 |
| Material | 170 | 119.2 | +0.1 | +0.8 | +2.5 |
| Tractors | 71 | 116.4 | +0.4 | +1.3 | +3.0 |
| Machinery and plant for cultivation | 36 | 121.5 | –0.3 | +0.9 | +1.9 |
| Machinery and plant for harvesting | 37 | 119.9 | 0.0 | 0.0 | +3.0 |
| Utility vehicles | 16 | 113.9 | +0.2 | +0.3 | +0.3 |
| Buildings | 72 | 125.8 | 0.0 | 0.0 | –1.0 |
- Sources: INSEE - SSP (Ministry of Agriculture)
Documentation
Methodology (pdf,122 Ko)
Pour en savoir plus
Time series : Indices of agricultural prices
