


 10 April 2014
2014- n° 84The Consumer Prices Index increased by 0.4% in March 2014; it rose by 0.6%, year-on-year Consumer price index - final results - March 2014
10 April 2014
2014- n° 84The Consumer Prices Index increased by 0.4% in March 2014; it rose by 0.6%, year-on-year Consumer price index - final results - March 2014
In March 2014, the Consumer Prices Index (CPI) increased by 0.4% (after +0.6% in February 2014). Compared with March 2013, it grew by 0.6% (down from +0.9%, year-on-year in February 2014). Excluding tobacco, the CPI increased by 0.5% in March 2014 and also by 0.5% year-on-year. Seasonally adjusted, the CPI was down 0.1% in March 2014. As in February 2014, the increase in the CPI in March 2014 came from the recovery in manufactured product prices after the period of sales, especially from its impact on clothing and footwear prices, and from seasonal pressures in service prices linked with the winter vacation period. On the other hand, energy prices and, in a lesser manner, food prices showed downward trends.
Monthly change: +0.4%; Year-on-year: +0.6%
In March 2014, the Consumer Prices Index (CPI) increased by 0.4% (after +0.6% in February 2014). Compared with March 2013, it grew by 0.6% (down from +0.9%, year-on-year in February 2014). Excluding tobacco, the CPI increased by 0.5% in March 2014 and also by 0.5% year-on-year. Seasonally adjusted, the CPI was down 0.1% in March 2014. As in February 2014, the increase in the CPI in March 2014 came from the recovery in manufactured product prices after the period of sales, especially from its impact on clothing and footwear prices, and from seasonal pressures in service prices linked with the winter vacation period. On the other hand, energy prices and, in a lesser manner, food prices showed downward trends.
Seasonal rebound in manufactured product prices
Following the end of the sale periods in most of the French departments, the prices of manufactured products bounced back (+1,3% in March 2014; +2.0% in March 2013). In particular, the prices of clothing and footwear climbed (+10.2% in March 2014; +12.2% in March 2013). There was also a smaller upward contribution from the sale end on other manufactured product prices in March 2014 : the prices of furniture and furnishing increased by 0.9% (+1.3% year-on-year), those of sport equipment, camping and open-air recreation by 3.7% (—1.0% year-on-year), those of travel goods by 3.5% (+1.5% year-on-year) and those of household appliances by 0.4% (—2.0% year-on-year). On the contrary, the prices of audiovisual, photographic and information processing equipment (—0.6%, —7.2% year-on-year) as those of health product (—0.4%; —3.0% year-on-year) continued to decline. Moreover, as a result of promotions, the prices of new cars fell by 1.8% in March 2014 (+1.7% year-on-year). Finally, in March 2014, the prices of manufactured products decreased by 0.8% compared with the same month one year ago.
tableauOLE_LINK2 – Detailed figures for various groups
| Percentage change | ||||
|---|---|---|---|---|
| Items | Weight 2014 | Index March 2014 | Month rate | Annual rate |
| a) All households - France | ||||
| All items (00 E) | 10000 | 128.20 | 0.4 | 0.6 |
| All items SA (00 C) | 10000 | 127.87 | -0.1 | 0.6 |
| Food (4000 E) | 1653 | 132.22 | 0.2 | -0.2 |
| Fresh food (4001 E) | 210 | 139.17 | 1.2 | -3.3 |
| Food excluding fresh products (4002 E) | 1443 | 131.22 | 0.0 | 0.3 |
| Tobacco (4034 E) | 204 | 258.56 | 0.0 | 7.0 |
| MANUFACTURED PRODUCTS (4003 E) | 2653 | 101.18 | 1.3 | -0.8 |
| Clothing and footwear (4004 E) | 438 | 111.11 | 10.2 | 0.6 |
| Medical products (4005 E) | 434 | 79.17 | -0.4 | -3.0 |
| Other manufactured products (4006 E) | 1781 | 104.36 | -0.2 | -0.6 |
| ENERGY (4007 E) | 850 | 179.01 | -0.6 | -1.6 |
| Petroleum products (4008 E) | 475 | 202.31 | -0.8 | -6.0 |
| SERVICES (4009 E) | 4640 | 135.71 | 0.3 | 1.8 |
| Actual rentals and services for dwellings (4010 E) | 748 | 142.17 | 0.1 | 1.5 |
| Medical services (4011 E) | 552 | 122.07 | 0.1 | 0.2 |
| Transport and communication services (4012 E) | 503 | 95.20 | -0.5 | 1.2 |
| Other services (4013 E) | 2837 | 146.44 | 0.5 | 2.3 |
| ALL ITEMS EXCLUDING RENTALS AND TOBACCO (5000 E) | 9202 | 125.67 | 0.5 | 0.4 |
| ALL ITEMS EXCLUDING TOBACCO (4018 E) | 9796 | 126.29 | 0.5 | 0.5 |
| b) Manual or clerical worker headed urban households - France | ||||
| ALL ITEMS EXCLUDING TOBACCO (4018 D) | 9707 | 126.05 | 0.4 | 0.5 |
| ALL ITEMS (00 D) | 10000 | 128.85 | 0.4 | 0.7 |
| c) Households that belong to the lowest equivalized disposable income quintile - France | ||||
| ALL ITEMS EXCLUDING TOBACCO (4018 Q) | 9679 | 127.33 | 0.4 | 0.4 |
- Source : Insee - Consumer Price Indexes
tableauTableau1English – Detailed figures for Core inflation* and HICP**
| Percentage change | ||||
|---|---|---|---|---|
| Items | Weight 2014 | Index March 2014 | Month rate | Annual rate |
| All items "Core inflation" (4022 S) | 6053 | 122.70 | 0.1 | 0.4 |
| Food excluding fresh products, meat, milk and exotic products (4019 S) | 713 | 125.96 | 0.0 | -0.3 |
| Manufactured products (4020 S) | 2162 | 105.15 | -0.2 | -0.7 |
| Services including actual rentals and services for dwellings (4021 S) | 3178 | 139.08 | 0.3 | 1.3 |
| All items HICP (00 H) | 115.92 | 0.5 | 0.7 | |
- * ISJ : Core inflation indicator excludes public sector prices, the most volatile consumer prices and the tax measures. Seasonal adjusted, this index is calculated for all households in France excluding overseas departments (base 100 in 1998).
- **HICP : Harmonised Indices of Consumer Prices are designed for comparison of consumer price inflation between Member States of the Union. This index is calculated for all households in France (base 100 in 2005).
- Source : Insee - Consumer Price Indexes
graphiqueGraphique1English – Consumer price index (IPC) and Core inflation (ISJ) – year-on-year changes
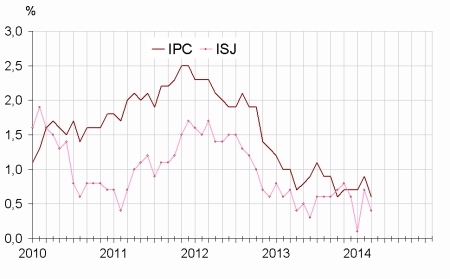
- Source : Insee - Consumer Price Indexes
Seasonal increase in the prices of services in March
In March 2014, the prices of services increased by 0.3% (+1.8% year-on-year, down from +1.9% in February 2014) mainly due to the changes in some service prices linked with the vacation period. Thus, the prices of package holidays grew by 8.3% in march 2014 (—1.3% year-on-year); those of rents for holiday homes by 5.5% (+2.7% year-on-year), those of hotels and restaurants by 1.2% (+2.9% year-on-year). On the opposite, there was a downward contribution from the prices of transport services between February and March this year in the wake of a fall of air transport
fares (—2.2%; —5.0% year-on-year). Moreover, if the prices of mobile phone services have slightly declined again in March 2014 (—0.1% as in February 2014), they sped up year-on-year (+3.1% in March 2014 up from +2.9% in february 2014).
Energy prices declined again
In March 2014, energy prices of energy were down 0.6% compared with February 2014 and by 1.6% compared with march 2013. The main downward effect came from a new decrease in petroleum product prices (—0.8% in March 2014; —6.0% year-on-year), higher for heating fuels (—1.6% in March 2014; —7.8% year-on-year) than for motor fuels (—0.7%; —5.9% year-on-year). There was also a downward contribution from city gas prices which decreased by 1.2% in March 2014 (—0.3% year-on-year) while electricity prices remained unchanged (+7.5% year-on-year).
Food prices were down in the year to March
Food prices increased by 0.2% in March 2014, mostly due to the seasonal rebound in fresh foodstuff prices (+1.2%), and especially from the large increase in fresh fruit prices (+5.1% in March 2014; +4,2% in March 2013; —2.0% betwwen March 2013 and March 2014) while the prices of fresh vegetables were flat (—0.1% in March 2014; —6.2% compared with the same month one year ago). In the year to March 2014, fresh foodstuff prices fell by 3.3% as supply was spurred by favourable weather conditions in recent months. Excluding fresh foodstuffs, food prices remained broadly stable in March 2014 (+0.3% year-on-year, as in February 2014). However, this relative stability conceals significant changes in prices trends, in particular, a recovery of dairy product prices (+0.8% in March 2014 for the group Milk, eggs and cheese and +0.8% compared with the same month one year ago), a decline in bread and cereal prices (—0.2%; —0.3% year-on-year) or a slowdown of meat prices (—0.2% in march 2014; +1.2% year-on-year). Finally, food prices decreased by 0.2% year-on-year in March 2014.
The core inflation indicator at a low level
In March 2014, the core inflation indicator (ISJ) increased by 0.1% and by 0.4% year-on-year (+0.7% in March 2013). The Harmonized Index of Consumer Prices (HICP) grew by 0.5% in March 2014 and by 0.7% compared with March 2013 (+1.1% year-on-year in March 2013).
Pour en savoir plus
