


 13 December 2013
2013- n° 285Sligth decrease in business start-ups in November 2013 Enterprise births - November 2013
13 December 2013
2013- n° 285Sligth decrease in business start-ups in November 2013 Enterprise births - November 2013
In November 2013, the number of business start-ups dipped sligthly compared to October: -0.1% for business setting up seasonally and working-day adjusted data (sa-wda) including self-managed enterprises. The increase in business start-ups excluding self-managed enterprises (+1.1% sa-wda) partly compensate the decrease in self-managed enterprises (-1.2% sa-wda).
Warning : From September 2013 data onwards, the seasonal and working-day adjustment model has been modified, for monthly business start-up data. Previously, only the time series for business set-ups excluding self-managed enterprises were seasonally adjusted. The self-managed enterprises time series were too short to be properly deseasonalized. From now on, the self-managed enterprises time series are seasonaly adjusted for each main sector. However, for the self-managed enterprises time series in the sectors of “Financial and insurance activities”, “Real estate” and “Trade, transport, accommodation and catering” , the raw data are similar to seasonally adjusted data, due to a low number of registrations and difficulty identifying a seasonal trend.
In November 2013, the number of business start-ups dipped sligthly compared to October: -0.1% for business setting up seasonally and working-day adjusted data (sa-wda) including self-managed enterprises. The increase in business start-ups excluding self-managed enterprises (+1.1% sa-wda) partly compensate the decrease in self-managed enterprises (-1.2% sa-wda).
+0.3% year-on-year (quarterly basis)
The amount of entries added up in the last quarter increased sligthly compared to the same quarter one year before (+0.3%).
The sectors that most contributed to that rise were education, health, social work and business support activities.
-4.0% year-on-year (twelve months basis)
During the last twelve months, the number of business start-ups decreased by 4.0% year-on-year.
More than one creation out of two is a self-managed enterprise
In November 2013, 51.3% businesses sets up were self-managed enterprises.
tableautab0 – business set-ups distribution by type %
| Sept. 2013 | Oct. 2013 | Nov. 2013 | |
|---|---|---|---|
| Companies | 29,4 | 29,5 | 29,5 |
| Individual enterprises | 18,5 | 18,9 | 19,3 |
| Self-managed business | 52,2 | 51,6 | 51,3 |
- Source: INSEE (Sirene)
tableautab1EN – Business set-ups by month
| Aug. 2013 | Sept. 2013 | Oct. 2013 | Nov. 2013 | |
|---|---|---|---|---|
| Excl. self-managed enterprises (sa-wda *) | 21 861 | 22 133 | 22 587 | 22 828 |
| Variation [m-o-m] % | 0.2 | 1.2 | 2.0 | 1.1 |
| Incl., self-managed enterprises | 43 889 | 45 784 | 45 365 | 45 326 |
| Variation [m-o-m] % | -1.6 | 4.3 | -0.9 | -0.1 |
- * Seasonally and working-day adjusted data
- Source: INSEE (Sirene)
tableautab2EN – business start-ups by type
| Moving total % change* | Moving total | Moving total | ||
|---|---|---|---|---|
| over 3 months | over 12 months | January- November 2013 | January- November 2012 | |
| Total | 0.3 | -4.0 | 497 955 | 513 120 |
| Companies | 1.0 | -2.8 | 144 714 | 146 708 |
| Individual enterprises | 0.0 | -4.5 | 353 241 | 366 412 |
| Of which self-managed | -8.1 | -11.9 | 256 603 | 289 897 |
- * Total of business start-ups during the last 3 or 12 months compared with the same months a year earlier
- // = meaningless
- Source: INSEE (Sirene)
graphiqueGraph1EN – Business start-ups
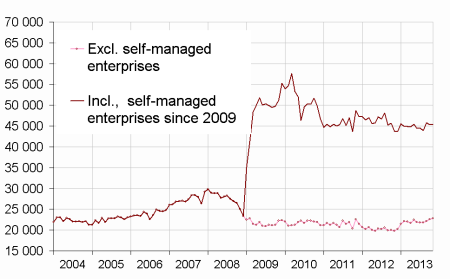
- * Seasonally and working-day adjusted data
- Source: INSEE (Sirene)
Pour en savoir plus
Time series : Business demography
