


 20 February 2013
2013- n° 43The Consumer Prices Index decreased by 0.5% in January 2013; it rose by 1.2% year-on-year Consumer price index - final results - January 2013
20 February 2013
2013- n° 43The Consumer Prices Index decreased by 0.5% in January 2013; it rose by 1.2% year-on-year Consumer price index - final results - January 2013
From January 2013, INSEE publishes each month a new CPI index, called “CPI of households that belong to the lowest equivalized disposable income quintile”. It is set aside for the calculation of the adjustment of the minimum wage growth (SMIC) as it is defined by Decree No. 2013-123, February 7th of 2013.
From January 2013, INSEE publishes each month a new CPI index, called “CPI of households that belong to the lowest equivalized disposable income quintile”. It is set aside for the calculation of the adjustment of the minimum wage growth (SMIC) as it is defined by Decree No. 2013-123, February 7th of 2013.
Monthly change: —0.5%; Year-on-year: +1.2%
In January 2013, the Consumer Price index (CPI) decreased by 0.5%, after a rise by 0.3% in December. Year-on-year, it rose by 1.2% (+1.3% in December). Excluding tobacco, the CPI went down also by 0.5% in January (+1.1% compared to January 2012). Seasonally adjusted, the CPI grew by 0.1% in January (+1.2 %, year on year). The largest downward pressure on the change in the CPI in January came mainly from seasonally price downturns in manufactured products, linked with winter sales. This decline was lightened by a rebound of energy prices and some upgrades in service rates which usually occurred in January. Furthermore, food prices decreased slightly in January.
Drops in manufactured product prices
In January 2013, prices of manufactured goods decreased by 2.3% (—0.2% year on year), drawn down by the winter sales. For this reason, clothing and footwear prices dropped by 11.3% in January (—10.9% in January 2012; +0.7% over a year). Likewise, prices for household appliances decreased by 1.3% (—0.8% in January 2012; —2.0% year on year), as those of furniture and furnishings by 2.1% (—2.3% in 2012; +0.7% year on year) and those of household textiles by 5.7% (—3.1% in 2012; +4.7% year on year). Moreover, the decline in audio-visual, photographic and information processing equipment prices carried on (—1.1% in January 2013; 7.1% year on year), such as telephony and fax equipment prices (—2.7%; —10.3% year on year). Finally, the new scales of ecological malus contributed to the increase in the new car prices in January (+1.7% ; +2.6% year on year).
tableauOLE_LINK2 – Detailed figures for various groups
| Items | Weight 2013 | Index Juan. 2013 | Month rate (%) | Annual rate (%) |
|---|---|---|---|---|
| a) All households - France | ||||
| All items (00 E) | 10000 | 126,11 | –0,5 | 1,2 |
| All items SA (00 C) | 10000 | 126,83 | 0,1 | 1,2 |
| Food (4000 E) | 1658 | 131,65 | –0,1 | 2,1 |
| Fresh food (4001 E) | 210 | 138,72 | –1,0 | 8,3 |
| Food excluding fresh products (4002 E) | 1448 | 130,64 | 0,1 | 1,3 |
| Tobacco (4034 E) | 206 | 241,53 | 0,1 | 6,9 |
| MANUFACTURED PRODUCTS (4003 E) | 2738 | 99,83 | –2,3 | –0,2 |
| Clothing and footwear (4004 E) | 458 | 98,81 | –11,3 | 0,7 |
| Medical products (4005 E) | 455 | 81,80 | –0,9 | –4,1 |
| Other manufactured products (4006 E) | 1825 | 104,35 | –0,4 | 0,6 |
| ENERGY (4007 E) | 822 | 179,67 | 1,8 | 2,0 |
| Petroleum products (4008 E) | 495 | 210,33 | 1,3 | –0,6 |
| SERVICES (4009 E) | 4576 | 132,52 | 0,0 | 1,2 |
| Actual rentals and services for dwellings (4010 E) | 748 | 139,11 | 0,1 | 1,9 |
| Medical services (4011 E) | 542 | 121,66 | –0,1 | 1,3 |
| Transport and communication services (4012 E) | 506 | 94,96 | –2,7 | –6,1 |
| Other services (4013 E) | 2780 | 141,84 | 0,4 | 2,5 |
| ALL ITEMS EXCLUDING RENTALS AND TOBACCO (5000 E) | 9202 | 123,77 | –0,6 | 1,0 |
| ALL ITEMS EXCLUDING TOBACCO (4018 E) | 9794 | 124,36 | –0,5 | 1,1 |
| b) Manual or clerical worker headed urban households - France | ||||
| ALL ITEMS EXCLUDING TOBACCO (4018 D) | 9704 | 124,16 | –0,5 | 1,0 |
| ALL ITEMS (00 D) | 10000 | 126,72 | –0,5 | 1,2 |
| c) Households that belong to the lowest equivalized disposable income quintile - France | ||||
| ALL ITEMS EXCLUDING TOBACCO (4018 Q) | 9674 | 125,48 | –0,6 | 1,0 |
- Source : INSEE - Consumer Price Indexes
tableauTableau1English – Detailed figures for Core inflation* and HICP**
| Percentage change | ||||
|---|---|---|---|---|
| Items | Weight 2013 | Index Juan. 2013 | Month rate | Annual rate |
| All items "Core inflation" (4022 S) | 6085 | 121,94 | 0,1 | 0,8 |
| Food excluding fresh products, meat, milk and exotic products (4019 S) | 715 | 126,24 | 0,1 | 0,9 |
| Manufactured products (4020 S) | 2217 | 105,27 | –0,4 | 0,4 |
| Services including actual rentals and services for dwellings (4021 S) | 3153 | 137,10 | 0,3 | 0,9 |
| All items HICP (00 H) | 113,76 | –0,6 | 1,4 | |
- * ISJ : Core inflation indicator excludes public sector prices, most volatile consumer prices and tax measures. This index is seasonally adjusted. It is calculated for all households in France excluding overseas departments and territories (base 100 1998).
- **HICP : Harmonised Indices of Consumer Prices are inflation figures required under the Treaty on the functioning of the European Union. They are designed for international comparison of consumer price inflation between Member states of the Union. This index is calculated for all households in France (base 100 2005).
- Source : INSEE - Consumer Price Indexes
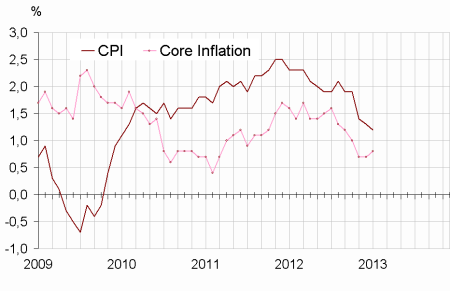
graphiqueGraphique1English – Consumer price index (IPC) and Core inflation (ISJ) – year-on-year changes
Energy prices rebounded in January
In January 2013, energy prices rebounded significantly as a consequence of rising rates of gas (+2.4%; +6.6% year on year) and electricity (+2.7%; +5.9% year on year). After four consecutive months of decline, prices of petroleum products increased by 1.3% in January (—0.6% year on year) in the wake of the rise in crude oil prices.
Service prices were steady
If services prices were stable in January (+ 1.2% year on year), the changes by major items of consumption were much more contrasted. Like every year, many tariffs increased in January. In particular, this is the case of taxis (+2.0%; +2.1% year on year), combined passenger transport (+2.5%. +0.1% year on year), postal services (+ 3.0%; + 3.5% year on year), fees and subscriptions to pay TV (+1.3%; +2.8% year on year) and service charges for insurance (+1.8%; +2.0% year on year). In contrast, after the end-of-year holidays, air fares fell in January (—10.9%; +2.8% year on year), like those of package travel prices (—19.0%; +5.0%. year on year) and those of holiday villages and holiday centers (—8.4%; + 9.0% year on year). Besides, the end of optional package for social security contributions paid by individual employers, from the first on January 2013, increased the cost of household services (+5.6%; +7.4%. year on year). Finally, communication prices slipped again (—2.6% in January 2013; —14.6% year on year) due to more favorable new mobile rates.
Slight decline in food prices
Food prices went down slightly in January 2013 (—0.1%; +2.1% year on year), due to a seasonally decrease in fresh foodstuff prices (—1.0% in 2013; —1.6% in 2012). Fresh fruit prices dropped (—4.6% in January 2013;+10.2% year on year) while those of fresh vegetable remained dynamic (+0.6% in January 2013; +9.8% year on year). Other food prices rose just a little in January (+0.1%; +1.3% year on year). The increase in alcoholic beverage prices (+1.3% in January; +3.5% year on year) mainly due to excise duty hikes were offset by price decreases (milk, yoghurt, cheese and non-alcoholic beverages). Meat prices and those of bread and cereals were steady in January (+2.9% and +0.9% respectively over a year).
Core inflation rises slightly in January
Core inflation indicator (ISJ) rose by 0.1% in January 2013 (+0.8% year-on-year. after +0.7% in December). The harmonized Index of Consumer Prices (HICP) decreased by 0.6% (+1.4%. year on year).
Pour en savoir plus
