


 14 February 2013
2013- n° 36Increase in business start-ups in January 2013 Enterprise births - January 2013
14 February 2013
2013- n° 36Increase in business start-ups in January 2013 Enterprise births - January 2013
In January 2013, the number of business start-ups increased compared to December: +4.9% for businesses set up (seasonally and working-day adjusted data) excluding self-managed enterprises; +25.6% if then number of self-managed enterprises (raw data) is added.
Warning : Only business start-ups data excluding self-managed enterprises (SME) are seasonally adjusted. In February 2012, the seasonal adjustment model was reviewed. In order to get the total number of enterprise creation, the raw number of SME is added. The SME time series is too short to be properly deseasonalized.
In January 2013, the number of business start-ups increased compared to December: +4.9% for businesses set up (seasonally and working-day adjusted data) excluding self-managed enterprises; +25.6% if then number of self-managed enterprises (raw data) is added.
-8.4% year-on-year (quarterly basis)
The amount of entries added up in the last three months decreased compared to the same months one year before (-8.4%).
The sectors that most contributed to that decrease were business support service activities and retail.
-1.1% year-on-year (twelve months basis)
During the last twelve months, the number of business start-ups decreased slightly by 1.1% year-on-year.
26,293 self-managed enterprises since the beginning of 2013
For the first month of 2013, more than one out of two businesses set up were self-managed enterprises (26,293).
tableautab0EN – Self-managed business set-ups
| Oct. 2012 | Nov. 2012 | Dec. 2012 | Jan. 2013 |
|---|---|---|---|
| 30 838 | 24 753 | 17 581 | 26 293 |
- Source: INSEE (Sirene)
tableautab1EN – Business set-ups by month
| Oct. 2012 | Nov. 2012 | Dec. 2012 | Jan. 2013 | |
|---|---|---|---|---|
| Excl. self-managed enterprises (sa-wda *) | 20 080 | 19 986 | 20 412 | 21 415 |
| Variation [m-o-m] % | 1.4 | -0.5 | 2.1 | 4.9 |
| Incl., in raw data, self-managed enterprises | 50 918 | 44 739 | 37 993 | 47 708 |
| Variation [m-o-m] % | 10.5 | -12.1 | -15.1 | 25.6 |
- * Seasonally and working-day adjusted data
- Source: INSEE (Sirene)
tableautab2EN – business start-ups by type
| Moving total % change* | Moving total | Moving total | ||
|---|---|---|---|---|
| over 3 months | over 12 months | January- January 2013 | January- January 2012 | |
| Total | -8.4 | -1.1 | 51 143 | 52 291 |
| Companies | -8.8 | -4.9 | 14 817 | 15 245 |
| Individual enterprises | -8.2 | 0.5 | 36 326 | 37 046 |
| Of which self-managed | -10.0 | 3.0 | 26 293 | 28 343 |
- * Total of business start-ups during the last 3 or 12 months compared with the same months a year earlier
- // = meaningless
- Source: INSEE (Sirene)
graphiqueGraph1EN – Business start-ups
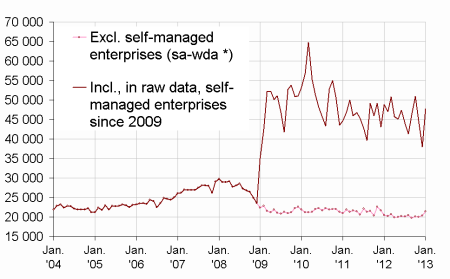
- * Seasonally and working-day adjusted data
- Source: INSEE (Sirene)
Pour en savoir plus
Time series : Business demography
