


 28 February 2013
2013- n° 51Overall producer prices of agricultural products slid in January Indices of agricultural prices - january 2013
28 February 2013
2013- n° 51Overall producer prices of agricultural products slid in January Indices of agricultural prices - january 2013
In January, overall producer prices of agricultural products dipped (-0.6 % compared to December) ; over one year they rose by 11.7 %.
Foreword : The seasonal series of producer price index have been seasonally adjusted including the year 2012.
In January, overall producer prices of agricultural products dipped (-0.6 % compared to December) ; over one year they rose by 11.7 %.
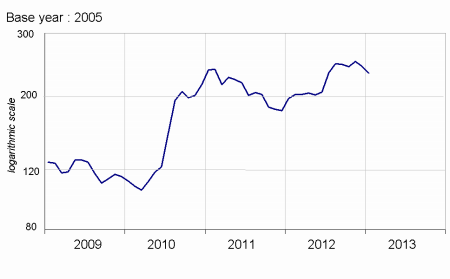
Cereals prices decreased in January (-4.4 %). Several financial operators sold amply at the end of the year and at the beginning of this month, expecting a weak rise in cereals prices in the near future
graphiquecereal – Producer price of cereals
Oleaginous prices dropped a little bit this month (–0.6 %) as a result of sunflower prices falling back, the business grinding of this seed being moderate.
Potato prices doubled in January compared to the same month last year (+114.2 %), due to a marked shortfall of supply in North-Western Europe. The bad weather in August spoiled practically a fifth of the crop in England and led as well to a substantial deficit of production in the Netherlands and in Belgium. The dry weather in France during September decreased the yields.
Wine prices did not change much in January (+0.2 %). Common wines, nevertheless, surged by almost 8 % over three months the less significant crop this year having led to a decreasing production.
Price of fresh fruits went up strongly in January year-over-year (+44.5 %). Prices of apple and pear rose respectively by 57 % and 31 %, due to a strong decrease in production in Europe.
graphiquevegetable – Producer price of fresh vegetable
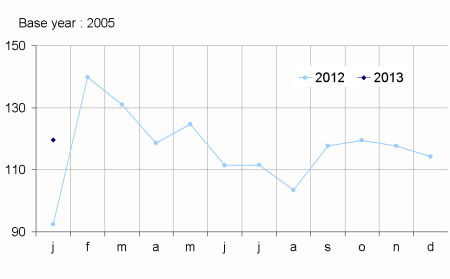
Vegetable prices increased year-over-year (+29.5 %). Onion prices picked up since the beginning of its commercial campaign as a result of a decreasing crop. On the demand side, the domestic consumption was sustained for leeks and chicories.
graphiquepig – Producer prices of pigs ans large cattle
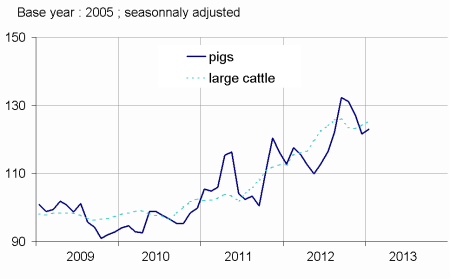
On a seasonally adjusted basis, price of animals globally increased in January (+1.0 %). Sheep prices dropped on as a result of foreign competition and sluggish demand, falling by almost 6 % over three months Egg prices noticeably decreased as the production bounced back (-16 %).
tableauTab1 – Indices of producer prices of agricultural products (IPPAP)
| Variation as % over | |||||
|---|---|---|---|---|---|
| weights | Jan 2013 | a month | 3 month | a year | |
| raw | seasonally adjusted data | raw | |||
| Agricultural goods output | 1000 | 142.9 | –0.6 | +0.2 | +11.7 |
| excluding fruits and vegetables | 878 | 144.6 | –1.2 | –0.1 | +9.6 |
| Crop output (excluding fruits and vegetables) | 417 | 166.7 | –2.0 | 0.0 | +15.4 |
| Cereals | 115 | 230.5 | –4.4 | –4.3 | +19.1 |
| of which soft wheat | 63 | 246.5 | –4.5 | –4.7 | +25.2 |
| grain maize | 27 | 208.5 | –4.7 | –2.7 | +17.3 |
| Potatoes | 19 | 236.0 | /// | /// | +114.2 |
| Wines | 161 | 130.0 | +0.2 | +4.5 | +7.1 |
| quality wines | 140 | 127.0 | +0.1 | +3.9 | +5.9 |
| other wines | 21 | 148.5 | +0.7 | +7.9 | +13.9 |
| Oleaginous | 28 | 217.8 | –0.6 | –1.4 | +7.1 |
| Horticultural products | 51 | 124.8 | +0.7 | +6.1 | +4.4 |
| Other crop products | 43 | 114.9 | –0.4 | –0.8 | +9.8 |
| Fruits and vegetables (1) | 122 | 130.7 | /// | /// | +31.6 |
| Fresh vegetables | 61 | 119.7 | /// | /// | +29.5 |
| Fresh fruits | 39 | 153.6 | /// | /// | +44.5 |
| Animal output | 461 | 124.5 | –0.2 | –0.1 | +3.3 |
| Animals | 286 | 126.3 | +1.0 | –0.2 | +9.2 |
| of which large cattle | 108 | 124.9 | +1.0 | +1.5 | +11.4 |
| calves | 29 | 124.1 | +1.3 | +3.3 | +2.7 |
| pigs | 64 | 114.7 | +1.1 | –6.3 | +9.0 |
| sheep | 14 | 118.0 | –2.6 | –5.9 | –4.8 |
| poultry | 59 | 149.1 | +1.3 | +2.3 | +12.4 |
| of which chicken | 26 | 150.5 | +1.7 | +2.1 | +13.9 |
| Milk | 159 | 115.8 | 0.0 | +1.9 | –3.4 |
| of which cow milk (2) | 148 | 116.0 | 0..0 | +2.0 | –3.7 |
| Eggs | 13 | 191.0 | –16.0 | –10.7 | –16.7 |
- (1) Including vegetables for industry.
- (2) The price for january is not yet known and therefore is estimated by carrying forward the seasonally adjusted price from December
- Sources: INSEE - SSP (Ministry of Agriculture)
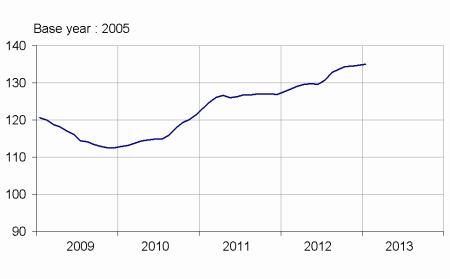
Purchase price of the means of agricultural production did not move much in January
The prices of intermediate consumptions almost stabilised in January (+0.2 %). Prices of animal feed increased by more than 20 % over one year. Prices of investment were almost stable (+0.1 %).
graphiquemeans – Purchase price of the means of agricultural production
- Sources: INSEE - SSP (Ministry of Agriculture)
tableauTab2 – Indices of purchase prices of the means of agricultural production (IPAMPA)
| weights | Jan 2013 | Variation as % over | |||
|---|---|---|---|---|---|
| a month | 3 month | a year | |||
| Total input | 1000 | 134.4 | +0.2 | +0.4 | +5.7 |
| Goods and services currently consumed in agriculture | 758 | 138.6 | +0.2 | +0.4 | +6.8 |
| Energy | 84 | 154.8 | +1.8 | –0.7 | +1.5 |
| Seeds | 51 | 120.5 | +0.7 | +0.9 | +3.7 |
| Fertilisers and soil improvers | 92 | 166.9 | –0.4 | –0.2 | +0.8 |
| Plant protection products | 77 | 104.8 | –0.6 | –1.6 | +0.3 |
| Animal feed | 189 | 164.4 | –0.3 | +1.2 | +22.0 |
| Veterinary expenses | 38 | 120.5 | +1.2 | +1.3 | +3.3 |
| Small equipment and tools | 14 | 113.0 | –0.8 | +0.4 | +2.0 |
| Maintenance of materials | 56 | 131.8 | +0.7 | +0.9 | +3.1 |
| Maintenance of buildings | 9 | 124.5 | 0.0 | 0.0 | +0.9 |
| Other goods and services | 149 | 113.5 | +0.2 | +0.7 | +1.0 |
| Goods and services contributing to investment | 242 | 121.3 | +0.1 | +0.5 | +1.9 |
| Material | 170 | 119.0 | +0.1 | +0.8 | +2.6 |
| Tractors | 71 | 116.0 | +0.3 | +1.1 | +2.7 |
| Machinery and plant for cultivation | 36 | 121.8 | 0.0 | +1.1 | +2.6 |
| Machinery and plant for harvesting | 37 | 120.0 | 0.0 | +0.7 | +3.2 |
| Utility vehicles | 16 | 113.6 | –0.5 | 0.0 | +0.4 |
| Buildings | 72 | 126.8 | 0.0 | 0.0 | +0.5 |
- Sources: INSEE - SSP (Ministry of Agriculture)
Documentation
Methodology (pdf,122 Ko)
Pour en savoir plus
Time series : Indices of agricultural prices
