


 2 April 2014
2014- n° 78In January 2014, the sales volume decreased in trade and repair of motor vehicles
and motorcycles and personal services Sales volume in the retail trade and personal services - January 2014
2 April 2014
2014- n° 78In January 2014, the sales volume decreased in trade and repair of motor vehicles
and motorcycles and personal services Sales volume in the retail trade and personal services - January 2014
In January 2014, the sales volume dropped in trade and repair of motor vehicles and motorcycles (–3.6%) and in household services (–1.4%). It was steady in retail trade, except for motor vehicles and motorcycles (0.0%) and in accommodation and food services activities (0.0%).

This publication is released on the 2 nd of April instead of the 31 st of March as announced because of a delay in the reception of the administrative data used to calculate the indexes .
Except indices from Emagsa survey, every index in this issue is in volume seasonally and working-day adjusted (SA-WDA).
The commentary shows evolutions of subsections by decreasing contributions. The contribution of a subsection depends on the extent of the evolution and on its weight.
In January 2014, the sales volume dropped in trade and repair of motor vehicles and motorcycles (–3.6%) and in household services (–1.4%). It was steady in retail trade, except for motor vehicles and motorcycles (0.0%) and in accommodation and food services activities (0.0%).
graphiqueGraph1_Anglais – Volume of sales in the retail trade and personal services
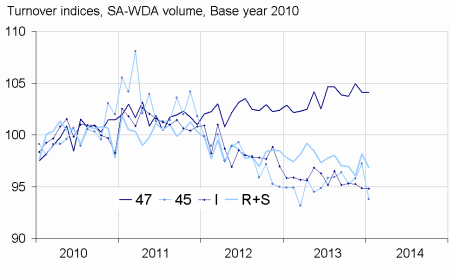
- Source: INSEE
Stability in the retail trade except for motor vehicles and motorcycles
In January, the sales volume in retail trade except for motor vehicles and motorcycles held steady (0.0%) after a decrease in December (–0.7%). In February, the sales volume is expected to rise by +0.4%.
This stability concerned specialised and non specialised stores (0.0%). In specialised stores, almost all sectors were stable except the retail sale of cultural and recreation goods which increased strongly (+3.4%) and the retail sale of automotive fuel which decreased (–1.9%). Over the last three months (q-o-q). the sales volume grew slightly in retail trade, except for motor vehicles and motorcycles (+0.3%) and more strongly year on year (+1.8%).
tableauTab1_anglais – Variation of sales volume in the retail trade and personal services
| Change in % | |||||
|---|---|---|---|---|---|
| NACE Classification | Weight | Jan./Dec. | Dec./Nov. | q-o-q (1) | y-o-y (2) |
| 47 Retail trade. except for motor vehicles and motorcycles | 1000 | 0.0 | –0.7 | 0.3 | 1.8 |
| 471 Retail sale in non-specialized stores | 369 | 0.0 | –1.0 | –1.0 | –0.3 |
| 472 to 477 Retail sale in specialized stores | 573 | 0.0 | –0.7 | 1.0 | 3.2 |
| 478 and 479 Retail trade not in stores | 58 | –0.3 | –0.1 | 1.4 | 2.0 |
| 45 Trade and repair of motor vehicles and motorcycles | 1000 | –3.6 | 1.5 | –0.3 | 0.6 |
| I Accommodation and food service activities | 1000 | 0.0 | –0.4 | –0.7 | –2.3 |
| R+S Household services | 1000 | –1.4 | 2.2 | –0.3 | –1.3 |
| R Arts. entertainment and recreation | 449 | –1.1 | 0.7 | –0.9 | –2.8 |
| S Other service activities | 551 | –1.6 | 3.4 | 0.1 | 0.0 |
- (1) Quarter-on-quarter: last three months / three previous months.
- (2) Year-on-year: last three months / three same months of the previous year.
- The codes correspond to different levels of aggregation of the classification NAF rev.2
- Source: INSEE
tableauTabprecoce_anglais – Variation of sales volume in the retail trade : early estimate*
| Change in% | ||
|---|---|---|
| Feb. 2014/Jan. 2014 | Feb. 2014/Feb. 2013 | |
| 47 Retail trade, except for motor vehicles and motorcycles | 0.4 | 2.4 |
- * Econometric estimate from a set of sources available within 30 days after the end of the reference month
- Source: INSEE
Sharp fall in trade and repair of motor vehicles and motorcycles
In January, the sales volume in trade and repair of motor vehicles and motorcycles plunged after two months of growth. Particularly, it slumped in sale of motor vehicles (–4.5%) and in sale of motor vehicles parts and accessories (–4.7%). The sales volume of the whole sector decreased slightly over the last three months (–0.3%) but increased moderately year on year (+0.6%).
tableauTab2_anglais – Variation of sales volume in the retail trade and personal services
| Variation in % | |||||
|---|---|---|---|---|---|
| Nace Classification | Weight | Jan. 2014 | Jan./ Dec. | Dec./ Nov. | q-o-q (1) |
| 47 Retail trade. except for motor vehicles and motorcycles | 1000 | 104.1 | 0.0 | –0.7 | 0.3 |
| 471 Non-specialised stores | 369 | 99.2 | 0.0 | –1.0 | –1.0 |
| 472 à 477 Specialised stores | 573 | 107.2 | 0.0 | –0.7 | 1.0 |
| 472 Retail sale of food. beverages and tobacco in specialised stores | 49 | 102.2 | 0.3 | –0.2 | 1.4 |
| 473 Retail sale of automative fuel | 78 | 96.9 | –1.9 | –0.2 | 1.5 |
| 474 Retail sale of information and communication equipment | 28 | 141.3 | 0.1 | 0.7 | 1.4 |
| 475 Retail sale of other household equipment | 112 | 100.3 | 0.1 | –0.2 | 0.3 |
| 476 Retail sale of cultural and recreation goods | 48 | 101.8 | 3.4 | –4.4 | 2.0 |
| 477 Retail sale of other goods in specialised stores | 258 | 111.7 | –0.2 | –0.6 | 0.9 |
| 478 et 479 Retail trade not in stores | 58 | 104.6 | –0.3 | –0.1 | 1.4 |
| 45 Wholesale and retail trade and repair of motor vehicles and motorcycles | 1000 | 93.8 | –3.6 | 1.5 | –0.3 |
| 451 Sale of motor vehicles | 671 | 92.7 | –4.5 | 3.6 | 0.4 |
| 452 Maintenance and repair of motor vehicles | 78 | 89.3 | –4.7 | 1.6 | –1.0 |
| 453 Sale of motor vehicle parts and accessories | 227 | 99.1 | –0.6 | –4.0 | –2.0 |
| 454 Sale. maintenance and repair of motorcycles and related parts and accessories | 24 | 88.0 | –1.8 | 0.3 | –0.8 |
| I Accommodation and food service activities | 1000 | 94.8 | 0.0 | –0.4 | –0.7 |
| 55 Accommodation | 255 | 97.0 | 0.6 | –0.8 | –1.0 |
| 56 Food and beverage service activities | 745 | 94.0 | –0.3 | –0.3 | –0.6 |
| 561 Restaurants… | 549 | 93.8 | 0.5 | –0.9 | –0.7 |
| 562 Event catering… | 116 | 98.2 | –4.6 | 2.6 | 0.1 |
| 563 Beverage serving activities | 80 | 89.4 | 1.2 | –0.6 | –1.6 |
| R+S Household services | 1000 | 96.8 | –1.4 | 2.2 | –0.3 |
| R Arts. entertainment and recreation | 449 | 95.8 | –1.1 | 0.7 | –0.9 |
| 90 Creative. arts and entertainment activities | 115 | 100.5 | 4.3 | 1.4 | 1.0 |
| 91 Libraries. archives. museums… | 11 | 103.4 | 0.5 | 3.4 | –7.2 |
| 92 Gambling and betting activities | 119 | 96.1 | –5.6 | –0.5 | –0.7 |
| 93 Sports activities and amusement.. | 204 | 92.6 | –1.4 | 0.9 | –1.7 |
| S Other service activities | 551 | 97.7 | –1.6 | 3.4 | 0.1 |
| 95 Repair of computers… | 228 | 97.3 | –3.3 | 5.3 | 1.7 |
| 96 Other personal service activities | 323 | 98.0 | –0.4 | 2.2 | –1.0 |
- (1) Quarter-on-quarter: last three months / three previous months.
- Source: Insee
Stability in accommodation and food service activities
After a slight fall in December (–0.4%), sales volume in accommodation and food services flattened out (0.0%). However a noticeable upturn was noted in restaurants and fast foods (+0.5%) and in accommodation (+0.6 %) and a sharp downturn in even catering, collective catering (–4.6%).
The sales volume of the whole sector decreased over the last three months (–0.7%) and in a stronger way year on year (–2.3%).
Decrease in household services
The sales volume in household services weakened in January (–1.4%) after a rise in December (+2.2%). Repair of computers (–3.3%) and gambling betting activities (–5.6%) plunged whereas creative arts and entertainment activities grew (+4.3%).
The sales volume in household services was down over the last three months (–0.3%) and year on year (–1.3%).
Révisions
Changes for December were revised by +0.3 point in wholesale trade and repair of motor vehicles and motorcycles and by –0.1 point in retail trade except for motor vehicles and motorcycles in accommodation and food services activities and in household services.
Monthly survey about major food retailers results
Turnover in major food retailers was stable in February (0.0%). Sales of automative fuel went on falling (–1.4%). Sales of food products (+0.1%) and non food products (–0.2%) were relatively steady.
tableauTab3_anglais – Monthly turnover indices in large-scale food retailing
| Variation in % | ||||
|---|---|---|---|---|
| Feb./ Jan. | Jan./ Dec. | T/T–1 (1) | T/T–4 (1) | |
| Turnover of large-scale food retailing | 0.0 | –1.1 | –1.1 | 0.3 |
| Including | ||||
| Sales of food products | 0.1 | –0.5 | –0.2 | 0.1 |
| Sales of non-foods products | –0.2 | 2.7 | –2.8 | –4.3 |
| Sales of automative fuel | –1.4 | –6.4 | –2.9 | –4.4 |
- (1) Quarter-on-quarter: last three months / three previous months.
- Source: INSEE - Monthly survey about large-scale food retailing (Emagsa)
Documentation
Methodology (pdf,121 Ko)
Pour en savoir plus
