


 25 March 2014
2014- n° 67In March 2014, the business climate remains almost stable in services Monthly survey of services - March 2014
25 March 2014
2014- n° 67In March 2014, the business climate remains almost stable in services Monthly survey of services - March 2014
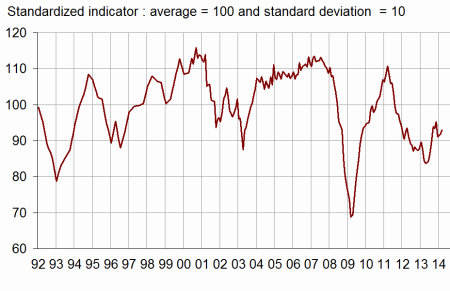
According to business managers, the economic situation in services improves slightly in March 2014. The business climate composite indicator has increased by one point compared to February and stands at 93, still below its long-term average (100). The turning point indicator now indicates a neutral economic outlook dynamic.
All services sector
According to business managers, the economic situation in services improves slightly in March 2014. The business climate composite indicator has increased by one point compared to February and stands at 93, still below its long-term average (100). The turning point indicator now indicates a neutral economic outlook dynamic.
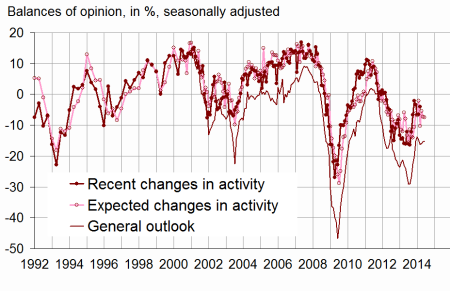
Less business managers than in February report a slowdown in their activity in the recent period. However, their expectations of activity remain pessimistic. The balance on the general outlook, which relates the assessment of business leaders over their whole sector remains below its long-term average.
Employment remains sluggish
In services sector except temporary employment agencies, the balances of opinion on past and expected employment are lower than their long-term averages.
tableauTable_quarter – Economic outlook in the services sector
| Average* | Dec. 13 | Jan. 14 | Feb. 14 | March 14 | |
|---|---|---|---|---|---|
| Composite indicator | 100 | 91 | 91 | 92 | 93 |
| General outlook | –7 | –16 | –16 | –15 | –15 |
| Past activity | 2 | –3 | –6 | –7 | –4 |
| Expected activity | 2 | –10 | –5 | –7 | –7 |
| Expected demand | 0 | –8 | –8 | –9 | –6 |
| Business situation | –2 | –14 | –15 | –13 | –11 |
| Past selling prices | –3 | –11 | –11 | –10 | –12 |
| Expected selling prices | –2 | –10 | –9 | –11 | –11 |
| Past employment | 3 | 7 | 2 | –2 | –4 |
| except temporary work agencies | 1 | –2 | 1 | –1 | –3 |
| Expected employment | 2 | –5 | –4 | –4 | –4 |
| except temporary work agencies | –1 | –8 | –7 | –8 | –6 |
| Investments | |||||
| Past investments | 1 | 0 | 1 | –2 | 0 |
| Expected investments | 1 | –1 | 2 | –5 | –7 |
- * Average of the balances of opinion since 1988
- Source: Insee
graphiqueGraph1 – Composite indicator
graphiquegraph_retourn – Turning point indicator
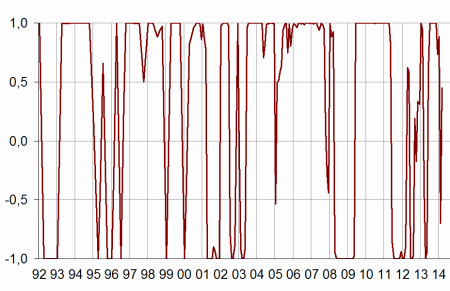
- Note: close to 1 (respectively -1), this indicator indicates a favorable short-term economic situation (respectively unfavorable).
graphiqueGraph2 – Activity
Road transport
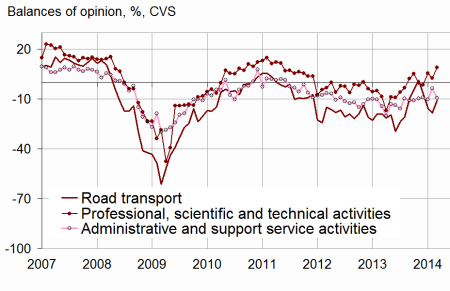
In road freight and mail activities, the balance of opinion on past activity is almost unchanged and stands over its long-term average. The balance of opinion on expected activity is around its long time average.
Accommodation and food service activities
In accommodation and food service activities, less business managers than in February report a slowdown in their activity in the past three months. However, their business and demand expectations remain pessimistic.
Information and communication
In information and communication, the balances of opinion on past activity and on expected activity are still well below their long-term average.
Real estate activities
In real estate activities, business managers consider that activity is at its average level. They revise their expectations of activity upwards for the incoming months.
Professional, scientific and technical activities
In professional, scientific and technical activities, business managers consider that activity has recovered in the recent months. However, they revise their expectations of activity and demand downwards.
Administrative and support service activities
In administrative and support service activities, the balance of opinion on past activity is almost stable. The balance of opinion on expected activity recovers and exceeds its long-term average.
graphiquegraph_bonus_ – Expected activity
tableauTable_det – Detailed data
| A21 | Average* | Dec. 13 | Jan. 14 | Feb. 14 | March 14 |
|---|---|---|---|---|---|
| (H) Road transport | |||||
| Past activity | –8 | –1 | –1 | 3 | 2 |
| Expected activity | –10 | –7 | –15 | –18 | –11 |
| Expected demand | –13 | –9 | –18 | –18 | –12 |
| Past employment | –8 | 0 | –1 | –6 | –9 |
| Expected employment | –11 | –13 | –10 | –16 | –11 |
| (I) Accommodation and food service activities | |||||
| Past activity | –7 | –17 | –19 | –14 | –8 |
| Expected activity | –7 | –15 | –15 | –21 | –22 |
| Expected demand | –9 | –14 | –19 | –25 | –25 |
| Past employment | –4 | –8 | –5 | –6 | –7 |
| Expected employment | –5 | –12 | –13 | –12 | –14 |
| (J) Information and communication | |||||
| Past activity | 10 | –11 | –22 | –24 | –19 |
| Expected activity | 11 | –24 | –7 | –17 | –15 |
| Expected demand | 12 | –5 | 0 | –4 | 8 |
| Past employment | 7 | –4 | –3 | –1 | –9 |
| Expected employment | 11 | –3 | –4 | –6 | –2 |
| (L) Real estate activities | |||||
| Past activity | 7 | –3 | 1 | 9 | 6 |
| Expected activity | 7 | 2 | 2 | 5 | 7 |
| Expected demand | 1 | –6 | –2 | –3 | –1 |
| Past employment | 3 | 2 | 5 | 7 | 0 |
| Expected employment | 2 | –1 | –5 | –1 | –3 |
| (M) Professional, scientific and technical activities | |||||
| Past activity | –1 | –7 | –8 | –7 | –1 |
| Expected activity | –2 | –9 | –10 | –3 | –9 |
| Expected demand | –5 | –12 | –10 | –11 | –14 |
| Past employment | 1 | 0 | –2 | –5 | –2 |
| Expected employment | 0 | –8 | –3 | –5 | –4 |
| (N) Administrative and support service activities | |||||
| Past activity | 6 | 9 | 13 | 4 | 3 |
| Expected activity | 5 | –1 | 6 | 3 | 9 |
| Expected demand | 3 | –7 | –3 | 0 | –3 |
| Past employment | 8 | 32 | 9 | 1 | –6 |
| Expected employment | 6 | 3 | 3 | 3 | 4 |
- * Average of the balances of opinion since 1988 (2006 for road transport)
Documentation
Methodology (2016) (pdf,158 Ko)
Pour en savoir plus
Time series : Economic outlook surveys – Services
