


 23 January 2014
2014- n° 16Demand adressed to the manufacturing industry is nearly stable in the fourth quarter
2013 Quarterly business survey (goods-producing industries) - January 2014
23 January 2014
2014- n° 16Demand adressed to the manufacturing industry is nearly stable in the fourth quarter
2013 Quarterly business survey (goods-producing industries) - January 2014
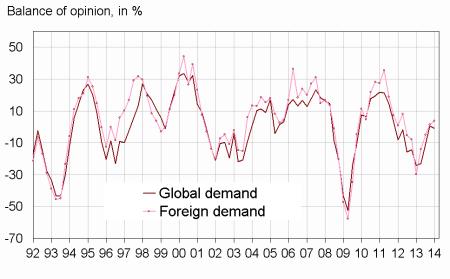
In the fourth quarter 2013, while the improvement of foreign demand has gone on, the one of global demand has stopped : the corresponding balances stand almost at their long-term average. The anticipations of industrialists about the expected change in global and foreign demand get better.
Demand
Slightly improvement of global and foreign demand
In the fourth quarter 2013, while the improvement of foreign demand has gone on, the one of global demand has stopped : the corresponding balances stand almost at their long-term average. The anticipations of industrialists about the expected change in global and foreign demand get better.
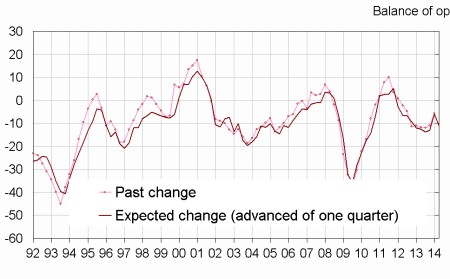
graphiqueGraphang1 – Past change in demand
Production factors
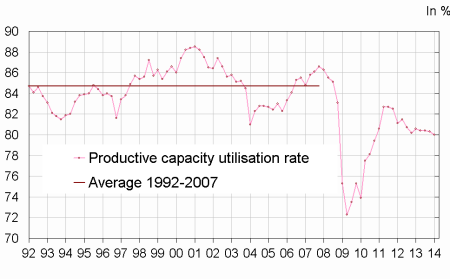
The tensions on the means of production are stable at a weak level
Over the fourth quarter 2013, the tensions of the means of production are almost unchanged at a weak level. So the productive capacity utilization rate is stable compared to the previous quarter and still remains below its average level, indicating that the means of production are underused in the manufacturing industry. The balance on production bottlenecks has slightly weaken at a level very close to its long-term average.
graphiqueGraphang2 – Change in the productive capacity utilization rate
tableautableau1 – Industrialists' opinion : demand and production factors
| Manufacturing industry | Aver.* | Avril 13 | Juil. 13 | Oct. 13 | Jan. 14 |
|---|---|---|---|---|---|
| Global demand | |||||
| Past change | 0 | –23 | –11 | 1 | –1 |
| Future change | 1 | –4 | –6 | 2 | 4 |
| Foreign demand | |||||
| Past change | 3 | –14 | –5 | 1 | 4 |
| Future change | 4 | 2 | –2 | 12 | 14 |
| Production factors | |||||
| Production bottlenecks (in %) | 22 | 25 | 23 | 25 | 23 |
| Assessment of productive capacity | 14 | 23 | 14 | 12 | 13 |
| Productive capacity utilization rate (in %) | 85 | 80 | 80 | 80 | 80 |
| Difficulties of supply and demand | |||||
| Difficulties of supply and demand | 8 | 12 | 12 | 11 | 11 |
| Difficulties of supply | 20 | 18 | 14 | 14 | 19 |
| Difficulties of demand | 44 | 47 | 50 | 46 | 49 |
- * : Long-term average.
- Source : Quarterly business survey - Insee
Workforce
Improvement of the balance on the past change of workforce size
According to the business managers, the rate of job losses in the industry has stabilized over the last months. Over the next months, industrialists are more pessimistic about the change in workforce size.
The percentage of companies experiencing hiring difficulties in the manufacturing industry has slightly decreased and is close to its long-term average.
graphiqueGraphang3 – Workforce size in the manufacturing industry
Wages and working time
According to the business managers in the manufacturing industry, the wages have increased by 0,4 % over the fourth quarter 2013.
In January, as many industrialists as in Octoberindicate a fall in the weekly working time, while more of them indicate a fall in the weekly working time over the next months.
Cash-flow and selling prices
In the fourth quarter 2013, the proportion of industrialists experiencing cash-flow problems is nearly steady compared to the previous quarter and is very close to its average level.
According to the business managers, the selling prices in the manufacturing industry have gone down in the fourth quarter 2013. They forecast a slightly increase in selling prices for the next quarter.
Competitive position
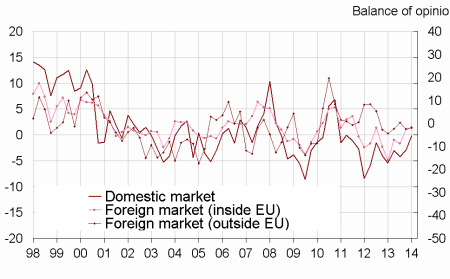
According to the industrialists, in the fourth quarter 2013, their competitive position have improved slightly on domestic market and on foreign markets inside and outside EU. The corresponding balances remain slightly below their average level on this three markets.
The general exportation expectations have became anew less favorable: the corresponding balance has decreased but remains close to its long-term average.
graphiqueGraphang4 – Competitive position
tableautableau2 – Industrialists ‘opinion : employment, competitive position, cash-flow, wags and selling prices
| Manufacturing industry | Aver.* | Avril 13 | Juil. 13 | Oct. 13 | Jan. 14 |
|---|---|---|---|---|---|
| Workforce size | |||||
| Past change | –11 | –12 | –12 | –11 | –6 |
| Expected change | –13 | –14 | –13 | –6 | –11 |
| Difficulties hiring | 28 | 27 | 27 | 28 | 26 |
| Working time | |||||
| Past change | –3 | –5 | –1 | 1 | 1 |
| Expected change | –5 | –7 | –2 | –1 | –4 |
| Cash-flow and wages | |||||
| Cash-flow problems | 15 | 14 | 15 | 14 | 13 |
| Past wages | 0,5 | 0,4 | 0,4 | 0,3 | 0,4 |
| Selling prices | |||||
| Past change | 0,2 | 0,4 | –0,6 | 0,2 | –0,5 |
| Expected change | 0,2 | 0,0 | 0,0 | –0,2 | 0,1 |
| Competitive position | |||||
| On domestic market | 1 | –3 | –4 | –3 | 0 |
| On foreign markets inside EU | 0 | –7 | –9 | –3 | –2 |
| On foreign markets outside EU | –1 | –2 | 0 | –3 | –2 |
| General exportation expectations | –10 | –43 | –31 | –5 | –13 |
- * : Long-term average.
- Source : Quarterly business survey - Insee
Documentation
Methodology (pdf,48 Ko)
Pour en savoir plus
Time series : Industry
