


 23 July 2014
2014- n° 171In July 2014, the business climate is slightly improving Monthly survey of services - July 2014
23 July 2014
2014- n° 171In July 2014, the business climate is slightly improving Monthly survey of services - July 2014
Warning : seasonal coefficients were updated for this survey.

Warning : seasonal coefficients were updated for this survey.
All services sector
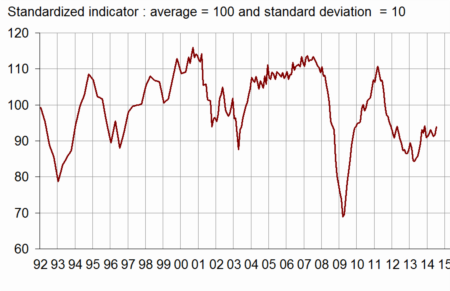
According to business managers, the economic situation in services is slightly improving in July 2014. The business climate composite indicator gains two points et is at 94 and the turning point indicator indicates a favorable dynamic.
The balance on the general outlook, which relates the assessment of business leaders over their whole sector is improving in July, but is still below its long-term average.
Business managers report that their activity has decreased over the last few months, but their business expectations for the coming months are more optimistic.
Business leaders believe that their operating balance result is more degraded than in April, but their expectation for the coming months are optimistic.
In services sector except temporary employment agencies, expected employment are pessimistic. Expected investments are slightly improving, close to their long-term average.
graphiqueGraph1 – Composite indicator
graphiquegraph_retourn – Turning point indicator
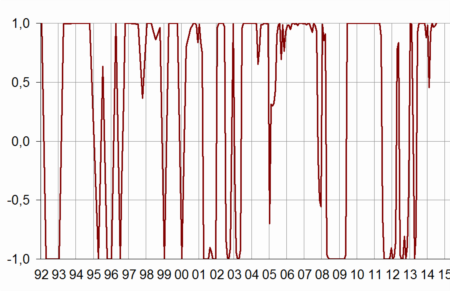
- Note: close to 1 (respectively -1), this indicator indicates a favorable short-term economic situation (respectively unfavorable).
tableauGraph1 – Economic outlook in the services sector
| Average* | April 14 | May 14 | June 14 | July 14 | |
|---|---|---|---|---|---|
| Composite indicator | 100 | 92 | 91 | 92 | 94 |
| General outlook | –8 | –14 | –15 | –16 | –15 |
| Past activity | 2 | –3 | –2 | –8 | –8 |
| Expected activity | 2 | –10 | –11 | –7 | –2 |
| Expected demand | 0 | –7 | –9 | –9 | –7 |
| Business situation | –3 | –7 | –5 | –9 | –13 |
| Past selling prices | –3 | –10 | –12 | –10 | –9 |
| Expected selling prices | –2 | –9 | –10 | –9 | –10 |
| Past employment | 3 | 2 | 2 | 0 | 0 |
| except temporary work agencies | 1 | 0 | –4 | –3 | –1 |
| Expected employment | 2 | –2 | –3 | –2 | –2 |
| except temporary work agencies | –1 | –3 | –4 | –3 | –3 |
| Investments | |||||
| Past investments | 1 | –2 | –3 | –3 | –2 |
| Expected investments | 1 | –3 | –5 | –1 | 0 |
| Operating balance result | |||||
| Past result | –2 | –7 | –17 | ||
| Expected result | –2 | –11 | –3 | ||
| Cash position | –11 | –12 | –15 | ||
| Difficulties of supply and demand | |||||
| difficulties of supply and demand | 10 | 11 | 12 | ||
| difficulties of supply only | 22 | 18 | 20 | ||
| difficulties of demand only | 31 | 38 | 39 | ||
| Difficulties in recruitment | 29 | 18 | 17 |
- * Average of the balances of opinion since 1988
- Source: Insee
Road transport
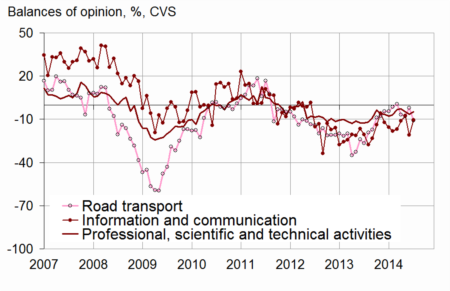
In road freight and mail activities, business managers’ judgment on past activity declines. The balances of opinion on expected activity and expected demand are improving.
Accommodation and food service activities
In accommodation and food service activities, business managers consider that activity has declined over the last few months and do not expect any improvement for the coming months.
Information and communication
In information and communication, the balance of opinion on past activity and expectations of activity and demand have improved in the recent months.
Real estate activities
In real estate activities, business managers report that activity has accelerated in the recent months, despite a deterioration in expected demand.
Professional, scientific and technical activities
In professional, scientific and technical activities, business managers indicate that their activity is unchanged over the last few months.
Administrative and support service activities
In administrative and support service activities, business managers indicate that activity has degraded in recent months although their expectations of activity for the coming months are good.
graphiquegraph_bonus_ – Past activity
tableauTable_det – Detailed data
| A21 | Average* | April 14 | May 14 | June 14 | July 14 |
|---|---|---|---|---|---|
| (H) Road transport | |||||
| Past activity | –8 | –7 | –8 | –2 | –11 |
| Expected activity | –9 | –6 | –8 | –13 | –7 |
| Expected demand | –13 | –12 | –13 | –14 | –7 |
| Past employment | –8 | –9 | –9 | –10 | –13 |
| Expected employment | –11 | –8 | –10 | –9 | –7 |
| (I) Accommodation and food service activities | |||||
| Past activity | –7 | –9 | –9 | –14 | –21 |
| Expected activity | –7 | –10 | –14 | –3 | –5 |
| Expected demand | –9 | –21 | –20 | –7 | –7 |
| Past employment | –4 | –10 | –9 | –1 | 4 |
| Expected employment | –5 | 1 | –12 | 1 | –7 |
| (J) Information and communication | |||||
| Past activity | 10 | –11 | –8 | –21 | –10 |
| Expected activity | 11 | –24 | –27 | –20 | –3 |
| Expected demand | 11 | –5 | –2 | –8 | –2 |
| Past employment | 7 | –2 | –7 | –11 | –2 |
| Expected employment | 11 | 4 | –1 | –4 | –9 |
| (L) Real estate activities | |||||
| Past activity | 7 | –5 | 5 | 5 | 4 |
| Expected activity | 7 | 7 | 9 | 2 | 1 |
| Expected demand | 1 | –2 | –5 | –4 | –3 |
| Past employment | 3 | 7 | –5 | –4 | 2 |
| Expected employment | 2 | –2 | –2 | 0 | 7 |
| (M) Professional, scientific and technical activities | |||||
| Past activity | –1 | –3 | –5 | –6 | –5 |
| Expected activity | –2 | –11 | –8 | –3 | –5 |
| Expected demand | –5 | –11 | –12 | –12 | –13 |
| Past employment | 1 | 1 | 1 | 3 | 0 |
| Expected employment | 0 | –3 | –1 | –5 | –1 |
| (N) Administrative and support service activities | |||||
| Past activity | 6 | 16 | 8 | –3 | –5 |
| Expected activity | 5 | –2 | –3 | –2 | 5 |
| Expected demand | 3 | 0 | –5 | –7 | –2 |
| Past employment | 8 | 14 | 15 | 6 | 4 |
| Expected employment | 6 | 2 | 2 | –1 | 6 |
- * Average of the balances of opinion since 1988 (2006 for road transport)
Documentation
Methodology (2016) (pdf,158 Ko)
Pour en savoir plus
Time series : Economic outlook surveys – Services
