


 25 February 2014
2014- n° 42In February 2014, the business climate is getting worse again in the retail trade
and in the trade and repair of motor vehicles Monthly survey of retailing - February 2014
25 February 2014
2014- n° 42In February 2014, the business climate is getting worse again in the retail trade
and in the trade and repair of motor vehicles Monthly survey of retailing - February 2014
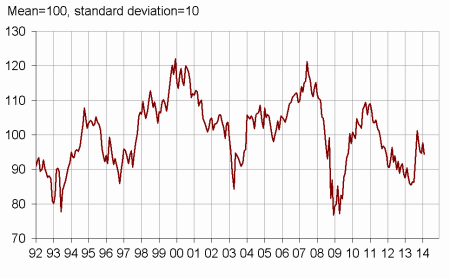
According to the managers surveyed in February 2014, the business climate is getting worse again in the retail trade and in the trade and repair of motor vehicles: the composite indicator has lost four points and got back to its December level, still under its long-term average.
According to the managers surveyed in February 2014, the business climate is getting worse again in the retail trade and in the trade and repair of motor vehicles: the composite indicator has lost four points and got back to its December level, still under its long-term average.
graphiquegraph_indsynt_en – Business climate synthetic indicator
More pessimistic forecasts
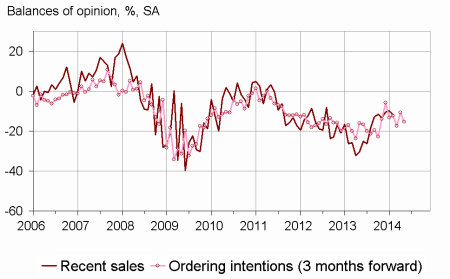
As many managers than in January have declared a decrease in their past activity. The corresponding balance has been almost stable for five months, slightly under its mean level. About forecasts, managers have been slightly pessimistic again: each of the three balances concerning expected sales, ordering intentions and general business outlook have moderatly declined, and remained under its average.
Stocks have been considered lower than the standard level.
The balance concerning expected prices has significantly deteriorated, getting back to April 2013 level.
graphiqueGraph_ventes_ic_en – Recent sales and ordering intentions
tableautab1_en – Global data
| Ave. (1) | Nov. 13 | Dec. 13 | Jan. 14 | Feb. 14 | |
|---|---|---|---|---|---|
| Business climate | 100 | 95 | 95 | 98 | 94 |
| General business outlook | –30 | –37 | –35 | –33 | –36 |
| Recent sales | –7 | –13 | –10 | –10 | –12 |
| Expected sales | –3 | –10 | –3 | –9 | –13 |
| Ordering intentions | –9 | –12 | –17 | –11 | –15 |
| Stocks | 11 | 9 | 11 | 12 | 8 |
| Past selling prices (2) | –6 | –6 | –13 | ||
| Expected selling prices | –3 | –4 | 1 | 0 | –10 |
| Cash position (2) | –15 | –25 | –23 | ||
| Workforce size: recent trend | 0 | –9 | –3 | –4 | –6 |
| Workforce size: future trend | –2 | –10 | –6 | –8 | –9 |
- (1) Average since 1991 (2004 for recent and expected sales and ordering intentions).
- (2) Bi-monthly question (odd-numbered months).
- Source: monthly survey in the retail trade and in the trade and repair of motor vehicles - INSEE
A little more job losses
According to business managers, job losses pace has slightly intensified over the last and the next few months. Each of the two balances has stayed under its average.
Retail trade
Dull past and expected activities
In both non-specialized and specialized trade, as many retailers than over January have declared falls in their past and expected activities. Each of the balances of both sectors, concerning recent sales, expected sales and ordering intentions has remained under its mean level.
Stocks have been overall estimated lower, getting back to their standard level.
More retailers than in the previous survey have declared a drop in expected prices.
Trade and repair of motor vehicles
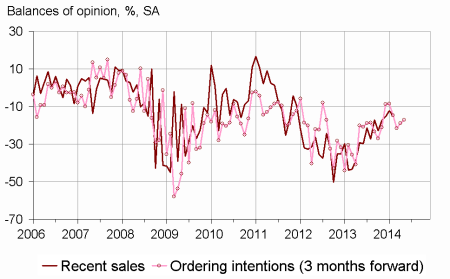
graphiquegraph_ventes_ic_auto_en – Recent sales and ordering intentions in motor vehicles
Past and expected activities near their averages
According to vehicle traders, activity has declined over the last few months, and might decrease again in the future, as expected sales and ordering intentions show it. Each of the three balances has got slightly under its average yet.
The level of stocks has been considered stable, still very low under the standard level.
More vehicles traders than in January have expected a fall in selling prices.
tableautab2_en – Detailed data
| Ave. (1) | Nov. 13 | Dec. 13 | Jan. 14 | Feb. 14 | |
|---|---|---|---|---|---|
| Retail trade - Global data | |||||
| Recent sales | –5 | –12 | –8 | –9 | –10 |
| Expected sales | 0 | –11 | 6 | –11 | –14 |
| Ordering intentions | –7 | –12 | –17 | –12 | –15 |
| Stocks | 10 | 9 | 13 | 15 | 9 |
| Past selling prices (2) | –8 | –7 | –15 | ||
| Expected selling prices | –4 | –5 | –2 | –5 | –12 |
| Cash position (2) | –13 | –23 | –20 | ||
| Workforce size: recent trend | 1 | –7 | –1 | 0 | –3 |
| Workforce size: future trend | –2 | –10 | –4 | –5 | –6 |
| Non-specialized retail trade | |||||
| Recent sales | –1 | –7 | –5 | –6 | –9 |
| Expected sales | 6 | 1 | 18 | –13 | –13 |
| Ordering intentions | 2 | 0 | –13 | –7 | –10 |
| Stocks | 7 | 5 | 13 | 20 | 10 |
| Past selling prices (2) | –7 | –2 | –17 | ||
| Expected selling prices | –4 | –4 | 1 | –7 | –16 |
| Cash position (2) | –7 | –12 | –10 | ||
| Specialized retail trade | |||||
| Recent sales | –9 | –17 | –12 | –12 | –12 |
| Expected sales | –7 | –20 | –5 | –19 | –18 |
| Ordering intentions | –17 | –20 | –22 | –26 | –23 |
| Stocks | 14 | 14 | 14 | 9 | 8 |
| Past selling prices (2) | –8 | –12 | –12 | ||
| Expected selling prices | –4 | –7 | –6 | –2 | –7 |
| Cash position (2) | –22 | –36 | –31 | ||
| Trade and repair of motor cars and motorcycles | |||||
| Recent sales | –11 | –17 | –15 | –12 | –15 |
| Expected sales | –9 | –11 | –19 | –8 | –11 |
| Ordering intentions | –14 | –15 | –22 | –19 | –17 |
| Stocks | 15 | 6 | 7 | 5 | 5 |
| Past selling prices (2) | 1 | –6 | –9 | ||
| Expected selling prices | 4 | 2 | 5 | 2 | –7 |
| Cash position (2) | –26 | –30 | –31 | ||
| Workforce size: recent trend | –10 | –20 | –16 | –18 | –18 |
| Workforce size: future trend | –8 | –15 | –15 | –17 | –15 |
- (1) Average since 1991 (2003 for trade and repair of motor vehicles and 2004 for recent and expected sales and ordering intentions).
- (2) Bi-monthly question (odd-numbered months).
- Source: monthly survey in the retail trade and in the trade and repair of motor vehicles - INSEE
Documentation
Methodology (pdf,129 Ko)
Pour en savoir plus
