


 30 January 2014
2014- n° 26In November 2013, the turnover in manufacturing industry remained stable compared
to October (+0.1%) Turnover in industry and construction - November 2013
30 January 2014
2014- n° 26In November 2013, the turnover in manufacturing industry remained stable compared
to October (+0.1%) Turnover in industry and construction - November 2013
In November 2013, the turnover levelled off in the manufacturing industry (+0.1%). Exports dropped (−1.7%). The turnover increased slightly in the industry as a whole (+0.2%).

Every index in this issue is in value, seasonally and working day adjusted.
In November 2013, the turnover levelled off in the manufacturing industry (+0.1%). Exports dropped (−1.7%).
The turnover increased slightly in the industry as a whole (+0.2%).
Sluggish fall over the last three months (−0.2%)
Over the quarter (q-o-q), the turnover declined marginally in the manufacturing industry (−0.2%). On the one hand, it decreased significantly in the electrical and electronic equipment; machine equipment (−1.1%), and it dipped in the manufacture of transport equipment (−0.6%) and in the manufacture of food products and beverages (−0.4%). On the other hand, it grew very slightly in other manufacturing (+0.2%). It flattened out in the manufacture of coke and refined petroleum products (0.0%).
Growth over the last year (+0.7%)
Year-on-year, the turnover climbed in the manufacturing industry (+0.7%). It improved in the manufacture of transport equipment (+2.4%) and in other manufacturing (+0.6%). Conversely, it dropped significantly in the manufacture of coke and refined petroleum products (−2.0%).
graphiqueIRgraph3 – Turnover in manufacturing industry
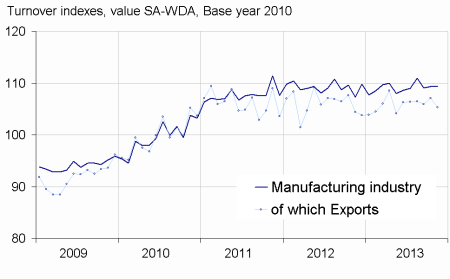
- Source: INSEE
Monthly variations
In November 2013, the turnover went up sharply in the manufacture of transport equipment (+2.0%), despite a dramatic downturn in exports (−6.2%). It rose slightly in other manufacturing (+0.2%); a sharp rise in the other manufacturing; repair and installation of machinery and equipment (+2.6%) is balanced by a significant fall in the manufacture of rubber and plastics products, and other non-metallic mineral products (−1.0%) and in the manufacture of basic pharmaceutical products and pharmaceutical preparations (−1.1%). The turnover also increased slightly in the manufacture of coke and refined petroleum products (+0.4%). On the other hand, it dropped in the manufacture of food products and beverages (−1.1%) and in the electrical and electronic equipment; machine equipment (−1.1%).
tableauIRtab5 – Variation in the turnover in industry and construction
| NA : A 10, (A 17) | Weight** | Nov./ Oct. | Oct./ Sept. | q-o-q (1) | y-o-y (2) |
|---|---|---|---|---|---|
| BE : INDUSTRY | 10000 | 0.2 | –0.1 | –0.1 | 0.3 |
| CZ : MANUFACTURING | 8373 | 0.1 | 0.2 | –0.2 | 0.7 |
| Of which Exports | 2731 | –1.7 | 1.1 | –0.3 | –0.1 |
| (C1): Manufacture of food products and beverages | 1647 | –1.1 | 0.4 | –0.4 | 0.9 |
| (C2): Manufacture of coke and refined petroleum products | 478 | 0.4 | –1.0 | 0.0 | –2.0 |
| (C3): Electrical and electronic equipment; machine equipment | 1005 | –1.1 | 0.7 | –1.1 | –0.8 |
| (C4): Manufacture of transport equipment | 1428 | 2.0 | 2.8 | –0.6 | 2.4 |
| (C5): Other manufacturing | 3815 | 0.2 | –0.8 | 0.2 | 0.6 |
| DE: Mining and quarrying; energy; water supply; waste management | 1627 | 0.7 | –1.7 | 0.5 | –1.1 |
| FZ: CONSTRUCTION | 10000 | 0.5 | –1.1 | 0.2 | 0.4 |
- ** 10000=B..E and F
- (1) Quarter-on-quarter: last three months / three previous months
- (2) Year-on-year: last three months / three same months of previous year
- The codes correspond to different levels of aggregation of the NACE classification.
- Source: INSEE
Documentation
Methodology (pdf,140 Ko)
Pour en savoir plus
Time series : Turnover indices (VAT)
