


 24 December 2013
2013- n° 298In Q3 2013, GDP (-0.1% after +0.6%) and households’ purchasing power (-0.1% after
+0.5%) slightly decreased Quarterly national accounts - detailed figures - 3rd quarter 2013
24 December 2013
2013- n° 298In Q3 2013, GDP (-0.1% after +0.6%) and households’ purchasing power (-0.1% after
+0.5%) slightly decreased Quarterly national accounts - detailed figures - 3rd quarter 2013
In Q3 2013, GDP in volume terms* was slightly down (–0.1%), after a rebound in Q2 (+0.6%).
In Q3 2013, GDP in volume terms* was slightly down (–0.1%), after a rebound in Q2 (+0.6%).
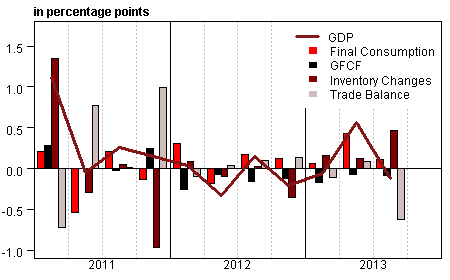
Household consumption expenditure decelerated (+0.1% after +0.4%). Furthermore, total gross fixed capital formation (GFCF) decreased by 0.4%, as in the previous quarter. Overall, final domestic demand (excluding inventory changes) marked time and had a neutral contribution to GDP after +0.4 point in Q2. Exports fell again (–1.3% after +1.9%) whereas imports remained dynamic (+0.9% after +1.5%). Hence, the foreign trade balance had a negative accounting contribution to GDP growth: –0.6 point, after +0.1 point the previous quarter. Conversely, changes in inventories contributed for +0.5 point to GDP growth (after +0.1 point).
Households’ purchasing power slowed down
Wages earned by households slightly decelerated (+0.3% after +0.5%), mainly due to deceleration of wages paid by non-financial corporations (NFC). Social benefits remained dynamic (+0.7% after +0.8% in previous quarter). In contrast, taxes on income and wealth accelerated again in Q3 (+1.9% after +1.4%) partly as a result of budget consolidation measures passed for 2013: de-indexation of the income tax thresholds, creation of a 45% bracket, lowering of the family quotient ceiling. Overall, in nominal terms, household disposable income slowed down (+0.1% after +0.4%).
graphiqueGraph1 – GDP and its main components
tableauTab1 – Goods and services:supply and uses chain-linked volumes
| 2012 Q4 | 2013 Q1 | 2013 Q2 | 2013 Q3 | 2012 | 2013 (ovhg) | |
|---|---|---|---|---|---|---|
| GDP | -0.2 | -0.1 | 0.6 | -0.1 | 0.0 | 0.1 |
| Imports | -1.2 | 0.1 | 1.5 | 0.9 | -0.9 | 0.9 |
| Households' consumption *expenditure | 0.0 | -0.1 | 0.4 | 0.1 | -0.4 | 0.3 |
| General government's *consumption expenditure | 0.4 | 0.4 | 0.7 | 0.2 | 1.4 | 1.6 |
| GFCF | -0.6 | -0.9 | -0.4 | -0.4 | -1.2 | -2.3 |
| *of which Non financial corporated and unincorporated enterprises | -0.4 | -0.8 | 0.1 | -0.4 | -1.9 | -1.9 |
| Households | -1.0 | -1.3 | -1.7 | -0.6 | -0.4 | -3.8 |
| General government | -0.7 | -0.5 | 0.3 | -0.2 | -0.6 | -1.2 |
| Exports | -0.8 | -0.3 | 1.9 | -1.3 | 2.5 | 0.2 |
| Contributions : | ||||||
| Internal demand excluding inventory changes | 0.0 | -0.1 | 0.4 | 0.0 | -0.1 | 0.1 |
| Inventory changes | -0.3 | 0.2 | 0.1 | 0.5 | -0.8 | 0.2 |
| Net foreign trade | 0.1 | -0.1 | 0.1 | -0.6 | 1.0 | -0.2 |
tableauTab2 – Sectoral accounts
| 2012 Q4 | 2013 Q1 | 2013 Q2 | 2013 Q3 | 2012 | 2013 (ovhg) | |
|---|---|---|---|---|---|---|
| Profit ratio of NFC* (level) | 28.0 | 28.0 | 28.2 | 27.7 | 28.3 | |
| Household purchasing power | -0.9 | 0.9 | 0.5 | -0.1 | -0.9 | 0.4 |
- *NFC: non-financial corporations
tableauTab3 – GDP and components: prices indices
| 2012 Q4 | 2013 Q1 | 2013 Q2 | 2013 Q3 | 2012 | 2013 (ovhg) | |
|---|---|---|---|---|---|---|
| GDP | 0.2 | 0.5 | 0.1 | 0.1 | 1.5 | 1.1 |
| Imports | 0.2 | -0.6 | -0.9 | 0.2 | 1.9 | -0.9 |
| Cons. Exp. : | ||||||
| - Households | 0.2 | 0.3 | -0.1 | 0.2 | 1.9 | 0.6 |
| - GG* | 0.1 | 0.1 | 0.0 | 0.1 | 1.1 | 0.5 |
| Total GFCF | 0.1 | 0.4 | -0.1 | 0.3 | 1.7 | 0.7 |
| - of which Households | -0.1 | 0.3 | -0.3 | 0.5 | 2.3 | 0.3 |
| - of which NFE | 0.1 | 0.6 | 0.0 | 0.3 | 1.3 | 1.0 |
| - of which GG | 0.2 | 0.2 | -0.1 | 0.3 | 2.2 | 0.7 |
| Exports | 0.2 | -0.2 | -0.4 | -0.2 | 1.2 | -0.1 |
- *GG: General Government
tableauTab4 – Manufactured goods: supply and uses in volume
| 2012 Q4 | 2013 Q1 | 2013 Q2 | 2013 Q3 | 2012 | 2013 (ovhg) | |
|---|---|---|---|---|---|---|
| Industrie’s production | -2.0 | 0.5 | 2.0 | -1.0 | -2.8 | 0.1 |
| - of which value added | -1.7 | 0.0 | 1.2 | -0.7 | -2.0 | -0.7 |
| Imports | -1.6 | 0.1 | 1.5 | 1.5 | 0.3 | 0.4 |
| Intermediate uses | -1.1 | 0.0 | 1.5 | -0.3 | -1.8 | 0.2 |
| Cons. Exp. : | ||||||
| - of households | -0.2 | -0.7 | 0.4 | 0.4 | -1.2 | -0.4 |
| - of GG | 1.6 | 1.5 | 1.4 | 1.0 | 4.3 | 4.7 |
| Total GFCF | -1.0 | -0.9 | -0.3 | 1.0 | -3.0 | -2.2 |
| - of which NFC | -1.1 | -1.1 | -0.4 | 1.1 | -3.7 | -2.7 |
| - of which GG | -0.1 | 0.0 | 0.2 | 0.2 | 1.0 | -0.1 |
| Exports | -1.7 | -0.5 | 2.8 | -1.9 | 3.0 | -0.1 |
| Inventory changes (contribution) | -0.9 | 1.1 | 0.1 | 0.9 | -2.5 | 0.8 |
tableauTab5 – Households’ disposable income and ratios of households’ account
| 2012 Q4 | 2013 Q1 | 2013 Q2 | 2013 Q3 | 2012 | 2013 (ovhg) | |
|---|---|---|---|---|---|---|
| HDI | -0.7 | 1.2 | 0.4 | 0.1 | 0.9 | 1.0 |
| Household purchasing power | -0.9 | 0.9 | 0.5 | -0.1 | -0.9 | 0.4 |
| HDI by cu* (purchasing power) | -1.1 | 0.7 | 0.3 | -0.2 | -1.5 | -0.1 |
| Adjusted HDI (purchasing power) | -0.6 | 0.7 | 0.5 | 0.0 | -0.4 | 0.6 |
| Saving rate (level) | 15.0 | 15.8 | 15.9 | 15.7 | 15.6 | |
| Financial saving rate (level) | 5.7 | 6.6 | 6.9 | 6.7 | 6.2 |
- *cu: consumption unit
tableauTab6 – Ratios of non-financial corporations’ account
| 2012 Q4 | 2013 Q1 | 2013 Q2 | 2013 Q3 | 2012 | |
|---|---|---|---|---|---|
| Profit share | 28.0 | 28.0 | 28.2 | 27.7 | 28.3 |
| Investment ratio | 19.2 | 19.1 | 19.0 | 19.0 | 19.4 |
| Savings ratio | 11.9 | 12.3 | 12.7 | 11.1 | 12.8 |
| Self-financing ratio | 61.8 | 64.4 | 66.9 | 58.5 | 65.9 |
Moreover consumption prices increased this quarter (+0.2% after –0.1% in Q2) therefore households’ purchasing power was slightly down (–0.1%, after +0.5%). Taken individually (measured per consumption unit), it decreased by 0.2% (after +0.3%).
Households’ consumption in value increased by 0.3% (as in previous quarter), faster than nominal income. Therefore the savings ratio stepped back from 15.9% to 15.7% in Q3.
Non financial corporation’s profit share at the lowest since 1985
In Q3 2013, non financial corporation’s value added decelerated sharply (–0.3% in current prices after +0.9%). Wages paid decelerated but still increased (+0.2% after +0.6%): employment decreased at the same rate (–0.2% after –0.1%) and wage per capita slowed down (+0.4% after +0.7%). Furthermore employee contributions and other taxes on production accelerated (+0.9% after +0.6%). Overall, gross operating surplus of non-financial corporations downturned (–2.1% after +1.7%) and their profit margin stepped back to 27.7% in Q3 (–0.5 point from Q2). It is the lowest level since Q4 1985.
GDP decrease is confirmed (–0.1%)
Compared to the previous release, GDP decrease in Q3 is unchanged (–0.1%). However the growth of GDP in Q2 is slightly scaled up from +0.5% to +0.6%. Revisions are due to the integration of data known since then and to the updates of seasonal adjustments. The annual growth rate carried over at Q3 point remains unchanged (+0.1%).
Pour en savoir plus
