


 31 May 2013
2013- n° 126Stability of services producer prices on the French market, decline on foreign markets Services producer price indices - 1st quarter 2013
31 May 2013
2013- n° 126Stability of services producer prices on the French market, decline on foreign markets Services producer price indices - 1st quarter 2013
In the first quarter of 2013, services producer prices sold to French businesses were stable on the whole (-0.2 % following +0.1 % in the last quarter), with detailed movements that were often seasonal.
- SPPI, production sold to French businesses
- Fall in prices for scientific and technical activities (–1.0 %) and for information and communication services (–0.7 %)…
- … while prices for real estate services (–0.1 %) were stable…
- … and prices for transportation and storage services moved up (+0,8 %).
- SPPI, production sold to households in France
- SPPI, production sold on foreign markets
- SPPI ( all markets)
Information : since this quarter, in accordance with the European directives, services producer price indices are calculated in base and reference 100 in 2010. They are no longer limited to the services sold to French businesses (BtoB), but are now extended to all markets (BtoAll).
SPPI, production sold to French businesses
In the first quarter of 2013, services producer prices sold to French businesses were stable on the whole (–0.2 % following +0.1 % in the last quarter), with detailed movements that were often seasonal.
Fall in prices for scientific and technical activities (–1.0 %) and for information and communication services (–0.7 %)…
The decline in advertising space prices affected prices for both media representation services (–11.3 % quarter over quarter, –6.3 % year over year) and programming and broadcasting services (–13.3 % quarter over quarter, –7.2 % year over year).
Prices for engineering services dropped significantly in this quarter (–1.5 %, following +0.9 %), as well as prices prix for computer services (–0.4 % following +0.8 %).
… while prices for real estate services (–0.1 %) were stable…
Renting prices for offices continued to dip (–0.4 % following –0.2 %), while prices for management services of real estate on a fee or contract basis rallied (+1.9 % following –1.6 %).
… and prices for transportation and storage services moved up (+0,8 %).
Prices for freight transport services by road increased (+0.6 % following –0.0 %), as well as prices for warehousing and storage services (+2.0 % following –0.1 %).
SPPI, production sold to households in France
Services producer price sold to households in France were almost unchanged in the first quarter of 2013 (+0.2 % following –2.1 %). The advance in prices for accomodation and food services (+1.4 % quarter over quarter, +2.6 % year over year) was offset by the drop in prices for information and communication services (–2.5 % quarter over quarter).
SPPI, production sold on foreign markets
Services producer prices sold on foreign markets moved down in the first quarter of 2013 (–1.0 % following +0.0 %). Prices for transportation and storage services fell (–1.6 %), most notably prices for sea freight water transport services which had risen significantly in the last quarter (–3.4 % following +15.5 %). On the other hand, prices for freight transport services by road advanced (+1.3 %).
SPPI ( all markets)
On all markets, services producer prices were stable (–0.1 % following –0.5 %).
graphiqueGraphique1 – Producer price indices for all services
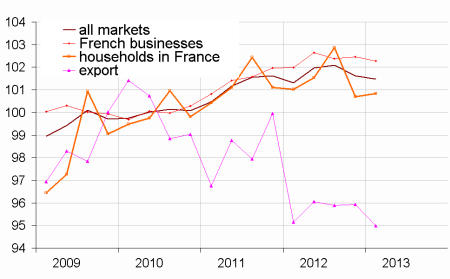
- Reference year: 2010
graphiqueGraphique2 – Services producer price indices, production sold to French businesses
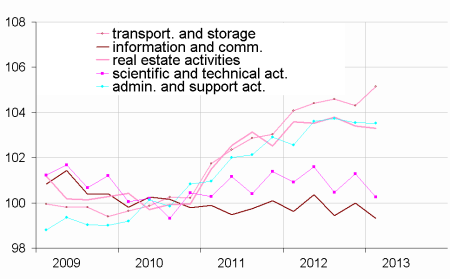
- Reference year: 2010
graphiqueGraphique3 – Services producer price indices, on all markets
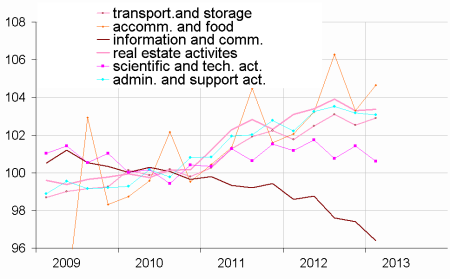
- Reference year: 2010
tableauTableau 1 – Services producer price indices, by sectors:
| Sections and choices of | Weight | Indices | Change in % | |
|---|---|---|---|---|
| levels in NAF rev.2 | 2013T01 | Q/Q-1 | Q/Q-4 | |
| Prices of services sold to French businesses (BtoB) | ||||
| HN : all services | 1000 | 102.3 | -0.2 | 0.3 |
| H : transport. and storage | 187 | 105.1 | 0.8 | 1.0 |
| 49.41 : freight trans. by road | 65 | 105.5 | 0.6 | 0.7 |
| J : information and comm. | 222 | 99.3 | -0.7 | -0.3 |
| 62 : IT services | 87 | 101.0 | -0.4 | 0.5 |
| L : real estate activities | 100 | 103.3 | -0.1 | -0.3 |
| M : prof. scient. and tech. act. | 200 | 100.3 | -1.0 | -0.6 |
| 69 : legal and accounting | 38 | 102.9 | 0.1 | -0.2 |
| 70.2 : management consult. | 43 | 101.1 | -0.1 | -0.1 |
| 71.12 : engineering | 64 | 99.8 | -1.5 | -0.3 |
| 73.1 : advertising | 26 | 96.8 | -3.9 | -2.3 |
| N : adminis. and support. act. | 260 | 103.5 | 0.0 | 0.9 |
| 77.1 : renting of motor veh. | 17 | 103.5 | 0.0 | -0.1 |
| 77.3 : renting of mach. eq. | 30 | 102.2 | -0.2 | -1.2 |
| 78 : employment activities | 50 | 105.9 | 0.3 | 1.6 |
| 81 : services to buildings and landscape activities | 28 | 104.4 | 0.8 | 2.0 |
| S95 : repair of computers and pers.. and household goods | 9 | 108.4 | 0.9 | 1.8 |
| Prices of services sold to households in France (BtoC) | ||||
| HN : all services | 1000 | 100.8 | 0.2 | -0.2 |
| H : transport. and storage | 168 | 103.3 | 0.2 | 1.5 |
| I : accomodation and food | 337 | 104.7 | 1.4 | 2.6 |
| J : information and comm. | 186 | 87.9 | -2.5 | -10.9 |
| L : real estate activities | 177 | 103.5 | 0.3 | 0.4 |
| M : prof.. scient. and tech. act. | 71 | 103.5 | 0.5 | 2.4 |
| N : adminis. and support act. | 43 | 98.9 | -0.9 | -3.2 |
| S95 : repair of computers and pers. and household goods | 18 | 107.9 | 0.8 | 1.6 |
| Export prices of services (BtoE) | ||||
| HN : all services | 1000 | 95.0 | -1.0 | -0.2 |
| H : transport. and storage | 473 | 92.2 | -1.6 | 0.9 |
| 49.41 : freight trans. by road | 64 | 106.6 | 1.3 | -0.7 |
| 50.20 : sea and coast. freight | 142 | 62.2 | -3.4 | -2.6 |
| 50.40 : inland freight water | 1 | 113.9 | -0.9 | -1.3 |
| 51.21 : freight air transport | 21 | 127.5 | 3.0 | 7.8 |
| Prices of services sold on all markets (BtoAll) | ||||
| HN : all services | 1000 | 101.5 | -0.1 | 0.2 |
| H : transport. and storage | 200 | 102.9 | 0.4 | 1.1 |
| I : accomodation and food | 98 | 104.6 | 1.3 | 2.5 |
| J : information and comm. | 208 | 96.4 | -1.0 | -2.2 |
| L : real estate activities | 113 | 103.4 | 0.1 | 0.3 |
| M : prof.. scient. and tech. | 167 | 100.6 | -0.8 | -0.6 |
| N : administ. and support | 204 | 103.1 | -0.1 | 0.8 |
| S95 : repair of computers and person. and household goods | 11 | 108.2 | 0.9 | 1.9 |
- Source: INSEE
Documentation
Simplified methodology (pdf,134 Ko)
Pour en savoir plus
Time series : Services producer price indices
