


 15 January 2013
2013- n° 12In December 2012, the prices of imported raw materials recovered Prices of oil and raw material imports - December 2012
15 January 2013
2013- n° 12In December 2012, the prices of imported raw materials recovered Prices of oil and raw material imports - December 2012
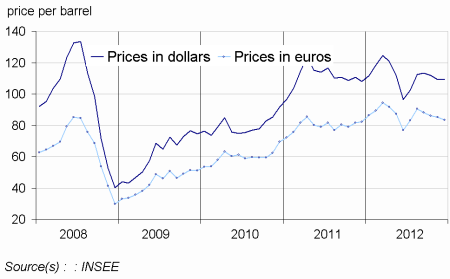
In December, the oil price in dollars remained stable (+0.0% after –2.2% in November). It stood at $109.3 per barrel of Brent. On the other hand, prices in foreign currencies, except energy imported into France, rebounded (+2.4% after –1.3% in November).
In December, the oil price in dollars remained stable (+0.0% after –2.2% in November). It stood at $109.3 per barrel of Brent. On the other hand, prices in foreign currencies, except energy imported into France, rebounded (+2.4% after –1.3% in November).
Crude oil prices in dollars stopped to decline
In December, the price in dollars of the barrel of oil from the North Sea (Brent) stabilized (+0.0% after –2.2% in November). However, in euros, the price of the barrel continued to decline (-2.2% after –1.2% in November), due to the appreciation of the euro against the dollar (+2.2%). On average over the year 2012, the price of Brent crude stood at $111.8, an increase of 0.7% compared to 2011. In euros, the increase was much stronger (+0.9%), compared to 2011.
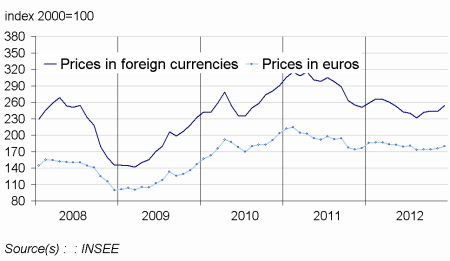
The prices of the industrial raw material rebounded
In December, the prices in foreign currencies of industrial raw materials rose (+4.5% after –0.2% in November). On one hand, the prices of mineral raw materials rebounded (+5.4% after -1.5% in November). Indeed, the prices of nonferrous metals increased sharply (+5.9% after -3.1%), especially those of copper (+3,5%), aluminium (+7.4%), nickel (+6.8%), zinc (+6.8%), or still titanium (+5.0%). However, prices of precious metals continued to decline (-1.3% after -1.6%), due to a further decline in prices of silver (-2.5%) and gold (-1.9%).
On the other hand, the prices of agricultural raw materials continued to grow (+2.2% after +3.5%), mainly those of sawn softwood of conifers (+9.6%), hides (+6.8%), natural rubber (+3.3%) and natural textile fibers (+3.3%) with the sharp rise in wool prices (+6.1%).
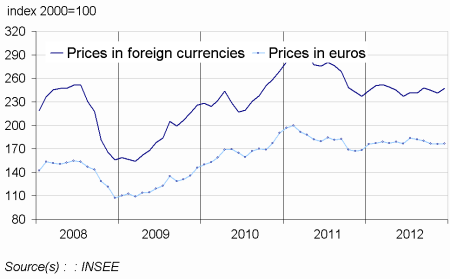
The decrease in prices of raw food materials moderated
In December, the decine in foreign currencies prices of raw food materials was less pronounced than in November (-1.1% after -3.1%). Prices of oilseeds registered a slight decline (-0.9% after –4.7%), due to the attenuation to the lower prices of soybean meal (-1.2% after –4.1%). On the other hand, the prices of palm oil continued to decline (-4.1% after –3.2%). Meanwhile, prices of sugar stabilized (-0.6%) after a sharp decline the previous month (-5.3%). The prices of tropical foodstuff continued to decline (-2.5%), including those of arabica (-4.1%), and cocoa (-3.1%), and those of cereals folded back (-1.1%). Indeed, thanks to an abundant supply from South America, prices of corn fell again (-3.0%).
tableautabpetrole – Oil and petroleum products
| Prices | Change (%) | |||
|---|---|---|---|---|
| of last month | over the last month | over the last 3 months | over the last 12 months | |
| Brent in $ per barrel | 109,3 | 0,0 | –3,6 | 1,1 |
| Brent in € per barrel | 83,3 | –2,2 | –5,4 | 1,3 |
| Gasoline | 0,7 | –4,1 | –16,5 | 3,6 |
| Gas Oil | 925,6 | –1,2 | –6,1 | 0,0 |
| Heavy fuel | 603,8 | –1,1 | –13,8 | –7,6 |
| Naphta | 941,3 | 1,1 | –2,7 | 7,6 |
- Prices are in dollars per tonne unless otherwise specified
- Source : INSEE
tableautabmatprem – Imported raw materials (excluding energy) in domestic currency
| Index | Changes (%) | |||
|---|---|---|---|---|
| over the last month | over the last 3 months | over the last 12 months | ||
| Food total | 262,4 | –1,1 | –8,4 | 9,8 |
| Tropical foodstuff | 219,8 | –2,5 | –8,8 | –4,6 |
| Oil seeds, vegetable oils | 336,0 | –0,9 | –12,0 | 34,1 |
| Cereals | 310,4 | –1,1 | –2,1 | 7,3 |
| Sugar | 235,7 | –0,6 | –1,4 | –18,0 |
| Beef meat | 160,7 | 0,3 | –3,5 | 0,7 |
| Industrial raw materials | 254,2 | 4,5 | 5,2 | 1,3 |
| Agricultural raw materials | 149,3 | 2,2 | 8,0 | 2,9 |
| Natural Fibers | 174,8 | 3,3 | 1,1 | –13,9 |
| Natural rubber | 356,6 | 3,3 | 4,7 | –16,2 |
| Hides | 118,0 | 6,8 | 9,6 | 31,1 |
| Wood pulp | 112,9 | –5,3 | –3,4 | –12,9 |
| Tropical wood | 143,8 | 0,0 | –0,9 | –2,6 |
| Sawn softwood | 143,7 | 9,6 | 24,9 | 49,2 |
| Minerals | 310,7 | 5,4 | 4,2 | 0,8 |
| Iron ore | 1035,1 | 7,1 | 29,6 | –5,6 |
| Non-ferrous metals | 238,3 | 5,9 | 0,4 | 2,4 |
| Precious metals | 435,5 | –1,3 | –3,3 | 5,1 |
| All commodities | 246,9 | 0,0 | 0,0 | 0,0 |
- Source : INSEE
graphiqueG_petrole_ang – Oil
- Source : INSEE
graphiqueG_alim_ang – Food
- Source : INSEE
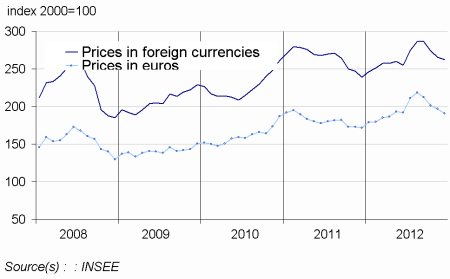
graphiqueG_ensemble_ang – All commodities
- Source : INSEE
graphiqueG_indus_ang – Industrial raw materials
- Source : INSEE
Pour en savoir plus
Time series : Raw materials prices
