


 14 December 2012
2012- n° 305In November 2012, imported raw materials prices decreased again Prices of oil and raw material imports - November 2012
14 December 2012
2012- n° 305In November 2012, imported raw materials prices decreased again Prices of oil and raw material imports - November 2012
In November, the price of crude oil in U.S. dollar terms continued to decline ( 2.3% after 1.4% in October). It stood at $109.3 per barrel of Brent. The prices in foreign curren-cies of commodities except energy imported into France went on decreasing too ( 1.3% after 1.2% in October).
In November, the price of crude oil in U.S. dollar terms continued to decline (–2.3% after –1.4% in October). It stood at $109.3 per barrel of Brent. The prices in foreign currencies of commodities except energy imported into France went on decreasing too (–1.3% after –1.2% in October).
Further decrease in crude oil prices
In November, the price of crude oil (North Sea Brent) in U.S. dollars per barrel fell for the second consecutive month (–2.3% after –1.4% in October). In Euro terms, the dip in oil prices was slightly less pronounced (–1.2% after –2.1%), due to the depreciation of the European currency against the U.S. dollar (–1.1%).
The prices of industrial raw materials receded
In November, the prices in foreign currencies of industrial raw materials were down (–0.2% after +0.9% in October). Indeed, the prices of mineral raw materials slipped (–1.5% after +0.4%). The prices of non–ferrous metals continued to fall (–3.1% after –2.1%), especially that of copper (–4.6%), nickel (–5.5%), titanium (–4.0%) and aluminum (–1.6%). The drop in precious metals prices also intensified (–1.6% after –0.4%), due to the decline in platinum (–3.6%) and gold (–1.5%).
The prices of agricultural raw materials, however, went on expanding (+3.5% after +2.1%), mainly because of the sharp increase in sawn softwood prices (+13.3%). The prices of natural rubber on the opposite corrected down markedly (–5.3% after +7.0%) and the prices of natural textile fibers fell again (–0.6%), notably that of cotton (–1.3%).
The prices of raw food materials went on declining
In November, raw food materials prices, in foreign currency terms, registered another drop (–3.1% after –4.3% in October). In particular, oilseeds prices tumbled again (–4.7% after –6.8%). As global supply is expected to run ahead of demand, the prices of soybean meal (–4.7%) and soybeans (–5.9%) went on sinking. Similarly, the prices of palm oil plunged for the fourth straight month (–3.2%), still due to the accumulation of stocks in Southeast Asia.
Tropical foodstuff prices also dropped (–2.0%), mainly that of arabica (–10.4%) and robusta (–6.3%). Finally, sugar prices fell significantly (–5.3%), thanks to abundant supply prospects, especially in Brazil, the world’s largest exporter. Cereals prices stabilized (+0.2% after –1.2%), due to the firming up of rice prices (+1.0%).
tableautabpetrole_ang – Oil and petroleum products
| Prices | Change (%) | |||
|---|---|---|---|---|
| over the last month | over the last month | over the last 3 months | over the last 12 months | |
| Brent in $ per barrel | 109.3 | –2.3 | –2.8 | –1.3 |
| Brent in € per barrel | 85.1 | –1.2 | –6.0 | 4.2 |
| Gasoline in $ per liter | 0.75 | –4.2 | –6.1 | 8.1 |
| Gas Oil | 936.8 | –4.8 | –2.9 | –3.8 |
| Heavy fuel | 610.4 | –5.7 | –11.7 | –7.8 |
| Naphtha | 931.5 | –2.4 | –0.3 | 7.7 |
- Prices are in dollars per ton unless otherwise specified
- Source : INSEE
tableautabmatprem_ang – Imported raw materials (excluding energy) in foreign currencies
| Index | Changes (%) | |||
|---|---|---|---|---|
| over the last month | over the last 3 months | over the last 12 months | ||
| Food total | 265.4 | –3.1 | –7.4 | 7.4 |
| Tropical foodstuff | 225.5 | –2.0 | –3.6 | –8.3 |
| Oil seeds, vegetable oils | 339.2 | –4.7 | –12.7 | 32.7 |
| Cereals | 313.7 | 0.2 | –2.1 | 3.6 |
| Sugar | 237.1 | –5.3 | –5.9 | –21.2 |
| Beef meat | 160.2 | –2.4 | –2.8 | 0.2 |
| Industrial raw materials | 243.2 | –0.2 | 5.1 | –4.5 |
| Agricultural raw materials | 146.1 | 3.5 | 3.5 | –0.7 |
| Natural Fibers | 169.2 | –0.6 | –2.7 | –23.0 |
| Natural rubber | 345.4 | –5.3 | 5.1 | –19.8 |
| Hides | 110.6 | 1.5 | 2.2 | 15.3 |
| Wood pulp | 119.2 | 0.4 | –1.2 | –13.7 |
| Tropical wood | 143.8 | –0.4 | 1.6 | –3.0 |
| Sawn softwood | 131.2 | 13.3 | 8.8 | 46.6 |
| Minerals | 294.9 | –1.5 | 5.8 | –5.7 |
| Iron ore | 966.7 | 5.6 | 11.6 | –11.2 |
| Non-ferrous metals | 225.1 | –3.1 | 4.0 | –4.4 |
| Precious metals | 441.3 | –1.6 | 9.0 | –0.2 |
| All commodities | 241.2 | –1.3 | 0.0 | –0.4 |
- Source : INSEE
graphiqueG_petrole_ang – Oil

- Source : INSEE
graphiqueG_alim_ang – Food
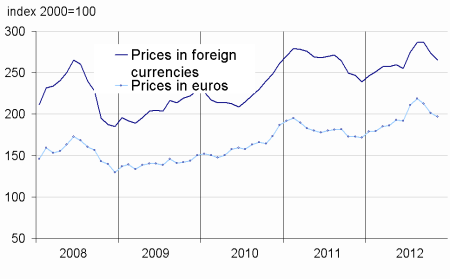
- Source : INSEE
graphiqueG_ensemble_ang – All commodities
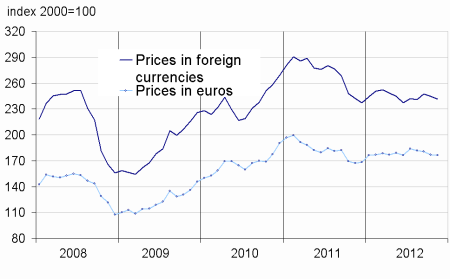
- Source : INSEE
graphiqueG_indus_ang – Industrial raw materials
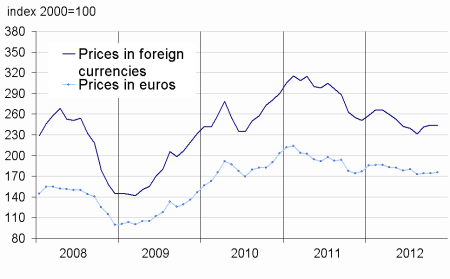
- Source : INSEE
Pour en savoir plus
Time series : Raw materials prices
