


 28 February 2014
2014- n° 48In January, decline in energy prices on all markets Industrial Producer and Import Price Indices - January 2014
28 February 2014
2014- n° 48In January, decline in energy prices on all markets Industrial Producer and Import Price Indices - January 2014
In January, French producer prices in industry for French market decreased (–0.6 %, after +0.1 % in December), driven down by the fall in prices for refined petroleum products ( 1.9 %) and for electricity and gas (–2.9 %), while prices for manufactured products were almost unchanged (–0.1 %).
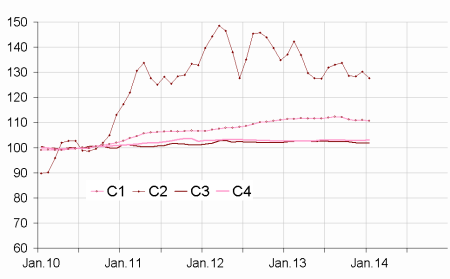
Producer price indices in French industry
FRENCH MARKET: –0.6 % in January
In January, French producer prices in industry for French market decreased (–0.6 %, after +0.1 % in December), driven down by the fall in prices for refined petroleum products ( 1.9 %) and for electricity and gas (–2.9 %), while prices for manufactured products were almost unchanged (–0.1 %).
Energy prices moved down…
Prices for refined petroleum declined in January following a rise in December (–1.9 % following +1.4 % ). In January the price for Brent crude sourced from the North Sea dropped in euro terms (–2.2 % against +1.1 %). Electricity prices fell significantly (–3.7 % following 0.0 % and +4.4 % in December and November, respectively). Gas prices went down (–0.8 %), following three consecutive months of rise.
Food prices dipped….
Food prices slipped slightly (–0.2 % after +0.1 % in December). Following the holiday season, meat prices fell significantly again (–2.9 % after +0.3 % in December and –1.3 % in November). Conversely, prices for dairy products advanced (+1.1 %), as well as beverage prices (+0.7 %), most notably beer (+1.9 %) and wines from grape (+1.4 %).
…while prices for “other manufactured products” increased
Prices for “other manufactured products” advanced moderately (+0.2 %), following two months of almost no change. The rise was mostly in prices for chemical products for the second month in a row (+0.7 % after +0.8 %), for other non-metallic mineral products (+0.4 % after +0.0 %) – notably cement (+2.3 %) – and repair and installation services of machinery (+0.3 %). Prices for pharmaceutical products were the only ones to fall (–0.4 %).
FOREIGN MARKETS: –0.2% in January
Producer prices of French industrial products sold on foreign markets moved down slightly (–0.2 %) following two months of no change. The decline in energy prices due to the fall in prices for both refined petroleum products (–4.0 %) and electricity was offset by the rise in prices for “other manufactured products” (+0.4 %), notably textiles (+1.8 %).
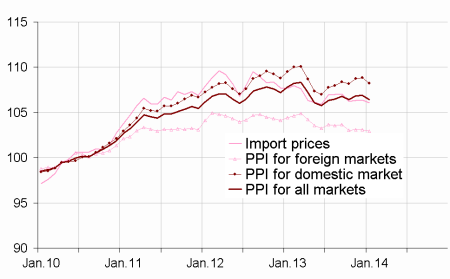
ALL MARKETS: –0.4 % in January
On all markets, prices fell (–0.4 % after +0.1 % in December). Year over year, the decline (–1.3 %) was true for all the categories of products, and particularly noticeable for refined petroleum products (–7.7 %)
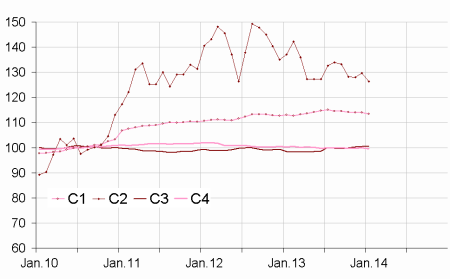
Import price indices of industrial products: –0.3 % in January
Import prices also decreased (–0.3 % after 0.0 %). Prices for refined petroleum products (–2.5 %) as well as electricity prices and to a lesser extent purchase prices for crude oil declined, driven by the price of petroleum. Food prices also dropped, as well as pharmaceutical products (–1.0 %) due to the commercialisation of some new generic drugs.
graphiqueGraphique1_EN – Total Industry price indices
graphiqueGraphique2_EN – Producer price indices of manufactured products sold on the french market
graphiqueGraphique3_EN – Import price indices of manufactured products
tableauTableau1 – French Producer Price Indices in industry according to the market where the products are sold:
| Change in % | ||||
|---|---|---|---|---|
| Levels A 10 and A 17 in CPF rev. 2, 2008 | Weight | Jan.14 | In 1 month | In 1 year |
| French market | ||||
| BE:TOTAL INDUSTRY | 1000 | 108.2 | –0.6 | –1.2 |
| (DE) Mining and quarrying, energy, water | 226 | 113.5 | –2.1 | –1.6 |
| CZ: Manufactured prod. | 774 | 106.6 | –0.1 | –1.1 |
| (C1) Food products, beverages, tobacco | 196 | 110.7 | –0.2 | –0.7 |
| (C2) Coke and refined petroleum products | 49 | 127.7 | –1.9 | –6.8 |
| (C3) Electrical & electronic equip., computers, mach. | 53 | 101.9 | 0.0 | –0.4 |
| (C4) Transport equipment | 80 | 103.0 | 0.1 | 0.2 |
| (C5) Other man. products | 396 | 103.3 | 0.2 | –0.7 |
| Foreign markets | ||||
| BE:TOTAL INDUSTRY | 1000 | 102.9 | –0.2 | –1.4 |
| CZ: Manufactured prod. | 980 | 103.1 | 0.0 | –1.2 |
| (C1) Food products, beverages, tobacco | 100 | 111.3 | –0.1 | 1.0 |
| (C2) Coke and refined petroleum products | 37 | 119.1 | –4.0 | –10.0 |
| (C3) Electrical & electronic equip., computers, mach. | 194 | 97.7 | –0.1 | –1.0 |
| (C4) Transport equipment | 252 | 103.5 | 0.1 | –0.4 |
| (C5) Other man. products | 397 | 102.3 | 0.4 | –1.3 |
| All markets | ||||
| BE:TOTAL INDUSTRY | 1000 | 106.4 | –0.4 | –1.3 |
| CZ: Manufactured prod. | 845 | 105.3 | –0.1 | –1.1 |
| (C1) Food products, beverages, tobacco | 163 | 110.8 | –0.2 | –0.3 |
| (C2) Coke and refined petroleum products | 45 | 125.3 | –2.5 | –7.7 |
| (C3) Electrical & electronic equip., computers, mach. | 102 | 99.1 | 0.0 | –0.8 |
| (C4) Transport equipment | 140 | 103.3 | 0.1 | –0.2 |
| (C5) Other man. products | 395 | 103.0 | 0.3 | –0.9 |
tableauTableau2 – Import prices of industrial products
| Change in % | ||||
|---|---|---|---|---|
| Levels A 10 and A 17 of nomenclature CPF rev. 2, 2008 | Weight | Jan.14 | In 1 month | In 1 year |
| BE:TOTAL INDUSTRY | 1000 | 106.0 | –0.3 | –1.5 |
| CZ: Manufactured prod. | s | 103.8 | –0.2 | –0.9 |
| (C1) Food products, beverages, tobacco | 69 | 113.5 | –0.4 | 0.3 |
| (C2) Coke and refined petroleum products | 47 | 126.4 | –2.5 | –7.7 |
| (C3) Electrical & electronic equip., computers, mach. | 227 | 100.4 | 0.0 | 2.0 |
| (C4) Transport equipment | 147 | 99.6 | –0.2 | –0.7 |
| (C5) Other manufactured products | s | 103.3 | 0.0 | –1.6 |
- r: updated ; nd: non available ; s : confidential
tableauTableau3 – Revision of each index at total industry level
| Oct.13 / Sep.13 | Nov.13 / Oct.13 | Dec.13 / Nov.13 | |
|---|---|---|---|
| French producer prices in industry sold on: | |||
| - the French market | // | // | -0.1(1) |
| - the foreign markets | –0.1 | // | // |
| - all markets | // | +0.1 | // |
| Import prices of industrial products | –0.1 | +0.1 | // |
- (1) Reading note: the evolution of the index between October and November 2013 published last month was equal to 0.2 %. It is updated to 0.1 %; that is to say a revision of +0.1 point.
Pour en savoir plus
