


 29 November 2013
2013- n° 274Stability in producer prices of services sold to businesses, rise in producer prices
of services sold to households and on foreign markets Services producer price indices - 3rd quarter 2013
29 November 2013
2013- n° 274Stability in producer prices of services sold to businesses, rise in producer prices
of services sold to households and on foreign markets Services producer price indices - 3rd quarter 2013
In the third quarter of 2013, services producer prices sold to French businesses were stable overall (+0.0% following +0.4% in the last quarter).
SPPI, production sold to French businesses
In the third quarter of 2013, services producer prices sold to French businesses were stable overall (+0.0% following +0.4% in the last quarter).
The decline in advertising prices (–1.7%) impacted media prices…
The seasonal decline in prices for advertising spaces affected prices for media representation services (–5.0% following +2.8%), and for radio broadcasting, television programming and broadcasting services (–2.1% following –1.1%).
Overall, prices for professional, scientific and technical services moved down this quarter (–0.5%, following +0.3%). In particular, prices for architecture and engineering services declined for the third consecutive quarter (–1.0% following –1.9%), in a weakened market.
…while prices for most other services sold to businesses remained stable
Prices for freight transport services were almost unchanged. Prices for passenger transport services were on the rise.
On the whole, prices for real estate services were stable (–0.2%, as in the last quarter).
Prices for administrative and support services rose moderately (+0.3% following +1.1%). Prices for employment services leveled off (+0.2% following +1.6%) but increased year over year (+2.7% following +1.5%). Prices for rental and leasing services of other machinery and equipment dropped slightly (–0.5% following +0.4%), due to a seasonal activity slowdown, most notably for office equipment and computers (–1.9% following +0.9%).
SPPI, production sold to households in France
Services producer price sold to households in France increased significantly in the third quarter of 2013 (+2.2% following +0.3%), mostly due to the seasonal rise in prices for accomodation and food services (+3.5% following +0.1% ; +1.7% year over year).
SPPI, production sold on foreign markets
Services producer prices sold on foreign markets advanced in the third quarter of 2013 (+1.9%, following +0.0%), most notably prices for transport and warehousing services (+4.6% following +0.5%), mainly sea freight water transport services (+9.3% following –7.6%).
SPPI (all markets)
On all markets, services producer prices rose (+0.6% following +0.4%), particularly for accomodation and food services.
graphiqueGraphique1 – Producer price indices for all services
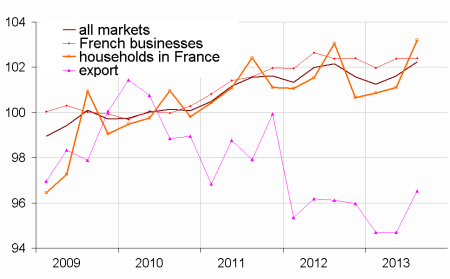
- Reference year: 2010
graphiqueGraphique2 – Producer price indices of services sold to French businesses
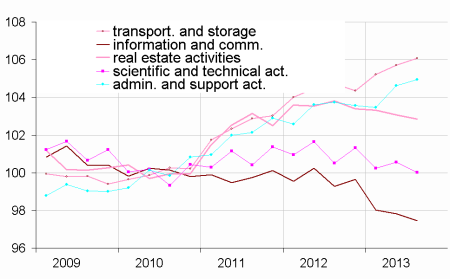
- Reference year: 2010
graphiqueGraphique3 – Services producer price indices, all markets
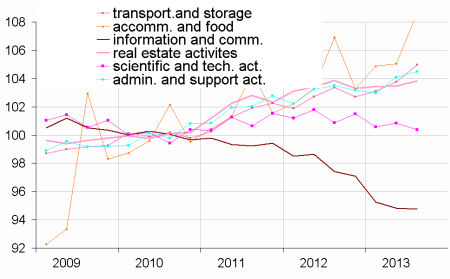
- Reference year: 2010
tableauTableau 2 – Services producer price indices, by sectors:
| Sections and choices of | Weight | Indices | Change in % | |
|---|---|---|---|---|
| levels in NAF rev.2 | 2013T03 | Q/Q-1 | Q/Q-4 | |
| Prices of services sold to French businesses (BtoB) | ||||
| HN : all services | 1000 | 102.4 | 0.0 | 0.0 |
| H : transport. and storage | 187 | 106.1 | 0.3 | 1.3 |
| 49.41 : freight trans. by road | 65 | 105.8 | 0.0 | 0.9 |
| J : information and comm. | 222 | 97.4 | -0.4 | -1.9 |
| 62 : IT services | 87 | 100.9 | -0.3 | 0.2 |
| L : real estate activities | 100 | 102.9 | -0.2 | -0.9 |
| M : prof., scient. and tech. | 200 | 100.0 | -0.5 | -0.5 |
| 69 : legal and accounting | 38 | 104.1 | 0.6 | 1.3 |
| 70.2 : management consult. | 43 | 101.8 | -0.3 | 1.0 |
| 71.12 : engineering | 64 | 98.5 | -0.9 | -1.9 |
| 73.1 : advertising | 26 | 95.7 | -1.7 | -1.9 |
| N : administ. and support | 260 | 104.9 | 0.3 | 1.2 |
| 77.1 : renting of motor veh. | 17 | 102.5 | 0.0 | -0.9 |
| 77.3 : renting of mach. | 30 | 101.9 | -0.5 | -1.5 |
| 78 : employment activities | 50 | 107.5 | 0.2 | 2.7 |
| 81 : services to buildings and landscape activities | 28 | 104.7 | 0.1 | 1.4 |
| S95 : repair of computers and person. and household goods | 9 | 108.9 | 0.2 | 1.5 |
| Prices of services sold to households in France (BtoC) | ||||
| HN : all services | 1000 | 103.2 | 2.1 | 0.1 |
| H : transport. and storage | 168 | 106.5 | 1.9 | 3.0 |
| I : accomodation and food | 337 | 108.7 | 3.5 | 1.7 |
| J : information and comm. | 186 | 87.5 | 1.2 | -10.2 |
| L : real estate activities | 177 | 105.4 | 1.2 | 1.5 |
| M : prof., scient. and tech. | 71 | 103.4 | -0.1 | 2.5 |
| N : administ. and support | 43 | 102.6 | 2.5 | -0.8 |
| S95 : repair of computers and person. and household goods | 18 | 108.5 | 0.3 | 1.4 |
| Export prices of services (BtoE) | ||||
| HN : all services | 1000 | 96.5 | 1.9 | 0.4 |
| H : transport. and storage | 473 | 97.3 | 4.6 | 3.4 |
| 49.41 : freight transp. by road | 64 | 108.0 | -0.1 | 2.7 |
| 50.20 : sea and coast. freight | 142 | 62.8 | 9.3 | 12.8 |
| 50.40 : inland freight water | 1 | 111.7 | 0.0 | -8.2 |
| 51.21 : freight air transport | 21 | 129.0 | 0.5 | 7.2 |
| 53 : postal and courier serv. | 13 | 110.8 | 0.0 | 3.1 |
| JB : telecommunications | 51 | 59.0 | 0.9 | -17.8 |
| 70.22 : busin. & mgt consult. | 46 | 97.8 | -0.2 | -2.8 |
| 71.12 : engin. & tech. consult. | 66 | 101.8 | 0.0 | -0.3 |
| Prices of services sold on all markets (BtoAll) | ||||
| HN : all services | 1000 | 102.2 | 0.6 | 0.1 |
| H : transport. and storage | 200 | 105.0 | 1.2 | 1.6 |
| I : accomodation and food | 98 | 108.7 | 3.4 | 1.6 |
| J : information and comm. | 208 | 94.7 | -0.1 | -2.8 |
| L : real estate activities | 113 | 103.8 | 0.4 | 0.0 |
| M : prof., scient. and tech. | 167 | 100.4 | -0.5 | -0.5 |
| N : administ. and support | 204 | 104.5 | 0.4 | 1.0 |
| S95 : repair of computers and person. and household goods | 11 | 108.7 | 0.3 | 1.6 |
- Source : INSEE
tableauTableau 3 – Measure of revision for each indicator at the HN 'all services' level
| Services producer price indices | 2013T02 / 2013T01 |
|---|---|
| - services sold on all markets | 0.1(1) |
| - services sold to French businesses | // |
| - services sold to consumers in France | 0.1 |
| - export of services | -0.2 |
- (1) Reading note : the change in index of services sold on all markets between the first quarter of 2013 and the second quarter of 2013 published in mid–September was +0.3 %. It has been revised at +0.4 % ; that is to say a revision of +0.1 %.
Documentation
Simplified methodology (pdf,134 Ko)
Pour en savoir plus
Time series : Services producer price indices
