


 15 October 2013
2013- n° 235The Consumer Prices Index decreased by 0.2% in September 2013; it rose by 0.9% year-on-year Consumer price index - final results - September 2013
15 October 2013
2013- n° 235The Consumer Prices Index decreased by 0.2% in September 2013; it rose by 0.9% year-on-year Consumer price index - final results - September 2013
The Consumer Price Index (CPI) was down 0.2% in September 2013 after a rise of 0.5% in August 2013. Seasonally adjusted, the CPI increased by 0.1% in September 2013. The CPI annual rate was 0.9% in September 2013, like in August 2013. Excluding tobacco, the CPI also decreased by 0.2% in September 2013 and increased by 0.7% compared with the same month one year ago.
Monthly change: — 0.2%; Year on year: + 0.9%
The Consumer Price Index (CPI) was down 0.2% in September 2013 after a rise of 0.5% in August 2013. Seasonally adjusted, the CPI increased by 0.1% in September 2013. The CPI annual rate was 0.9% in September 2013, like in August 2013. Excluding tobacco, the CPI also decreased by 0.2% in September 2013 and increased by 0.7% compared with the same month one year ago.
The largest contributions to the decline in the CPI in September 2013 came from seasonnal decreases in prices of some services at the end of the summer holidays and, in a lesser extend, from drops in food prices, particularly those of fresh foodstuffs. Conversely, after the end of summer sales in continental France, the prices of clothing and footwear and those of some manufactured products rose seasonally in September. Moreover, prices of energy increased again, driven by the rising price of petroleum products.
Seasonal decreases in service prices
For seasonal reasons, service prices decreased in September 2013 (— 1.2%; — 1.5 % in September 2012). In the year to September 2013, they were up 1.4 % (+ 1.1% in August 2013). This fall was mainly connected to the drop in prices of tourism services, particularly those of holiday accomodations (— 41.8%; + 2.2% year on year), package holidays (— 27.3%; + 0.3% year on year), rents for holiday residence (— 24.1%; + 1.7% year on year) and airfares (— 18.7% ; — 3.6% year on year). On the other hand, telecommunication prices rebounded strongly in September (+ 4.7%) as a result of the end of favourable mobile tariffs. However, the telecommunication tariffs were still down in September 2013 compared with the same month one year ago (— 4.0%).
tableauOLE_LINK2 – Detailed figures for various groups
| Items | Weight 2013 | Index Sept. 2013 | Month rate (%) | Annual rate (%) |
|---|---|---|---|---|
| a) All households - France | ||||
| All items (00 E) | 10000 | 127,43 | –0,2 | 0,9 |
| All items SA (00 C) | 10000 | 127,68 | 0,1 | 0,9 |
| Food (4000 E) | 1658 | 132,13 | –0,5 | 1,1 |
| Fresh food (4001 E) | 210 | 138,65 | –2,4 | 2,5 |
| Food excluding fresh products (4002 E) | 1448 | 131,19 | –0,2 | 0,9 |
| Tobacco (4034 E) | 206 | 249,81 | 0,0 | 10,5 |
| MANUFACTURED PRODUCTS (4003 E) | 2738 | 101,41 | 1,3 | –0,7 |
| Clothing and footwear (4004 E) | 458 | 111,37 | 7,2 | 0,9 |
| Medical products (4005 E) | 455 | 80,48 | 0,0 | –3,1 |
| Other manufactured products (4006 E) | 1825 | 104,23 | 0,2 | –0,5 |
| ENERGY (4007 E) | 822 | 181,29 | 0,8 | 0,7 |
| Petroleum products (4008 E) | 495 | 209,96 | 1,4 | –2,5 |
| SERVICES (4009 E) | 4576 | 133,72 | –1,2 | 1,4 |
| Actual rentals and services for dwellings (4010 E) | 748 | 139,82 | 0,1 | 1,8 |
| Medical services (4011 E) | 542 | 121,36 | 0,0 | 0,4 |
| Transport and communication services (4012 E) | 506 | 95,50 | –1,9 | –1,3 |
| Other services (4013 E) | 2780 | 143,67 | –1,6 | 2,0 |
| ALL ITEMS EXCLUDING RENTALS AND TOBACCO (5000 E) | 9202 | 124,99 | –0,3 | 0,6 |
| ALL ITEMS EXCLUDING TOBACCO (4018 E) | 9794 | 125,60 | –0,2 | 0,7 |
| b) Manual or clerical worker headed urban households - France | ||||
| ALL ITEMS EXCLUDING TOBACCO (4018 D) | 9704 | 125,42 | –0,3 | 0,7 |
| ALL ITEMS (00 D) | 10000 | 128,09 | –0,2 | 1,0 |
| c) Households that belong to the lowest equivalized disposable income quintile - France | ||||
| ALL ITEMS EXCLUDING TOBACCO (4018 Q) | 9674 | 126,80 | –0,3 | 0,7 |
- Source : Insee - Consumer Price Indexes
tableauTableau1English – Detailed figures for Core inflation* and HICP**
| Percentage change | ||||
|---|---|---|---|---|
| Items | Weight 2013 | Index Sept. 2013 | Month rate | Annual rate |
| All items "Core inflation" (4022 S) | 6085 | 122,41 | 0,0 | 0,6 |
| Food excluding fresh products, meat, milk and exotic products (4019 S) | 715 | 126,06 | 0,0 | 0,1 |
| Manufactured products (4020 S) | 2217 | 105,47 | 0,2 | –0,2 |
| Services including actual rentals and services for dwellings (4021 S) | 3153 | 138,36 | –0,1 | 1,3 |
| All items HICP (00 H) | 115,13 | –0,2 | 1,0 | |
- * ISJ : Core inflation indicator excludes public sector prices, the most volatile consumer prices and the tax measures. Seasonally adjusted, this index is calculated for all households in France excluding overseas departments and territories (base 100 1998).
- **HICP : Harmonised Indices of Consumer Prices are inflation figures designed for international comparison of consumer price inflation between Member states of the European Union. This index is calculated for all households in France (base 100 in 2005).
- Source : Insee - Consumer Price Indexes
graphiqueGraphique1English – Consumer price index (IPC) and Core inflation (ISJ) – year-on-year changes
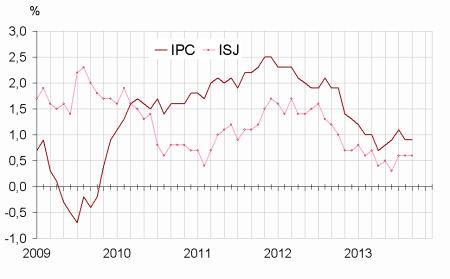
- Source : Insee - Consumer Price Indexes
Large drop in food prices
The food prices fell sharply in September 2013 (— 0.5%; +1.1 % year on year) mainly due to the drop in the prices of fresh foodstuffs (— 2.4%; + 2.5% year on year). A late supplying of seasonal fresh fruit on markets explains a large decrease in their prices in september 2013 (— 8.0%; + 2.6% year on year). Prices of fresh vegetables were almost stable in September (+ 0.1%; + 2.8% year on year). The prices of fresh fishes and shellfishes increased seasonally (+ 6.7%; + 1.6% year on year). Excluding fresh foodstuffs, food prices declined slighlty in September (— 0.2 %; + 0.9% year on year), due to the seasonnaly decrease in meat prices (— 0.3%; + 3.1% year on year) while, overall, the prices of non-alcoholic beverages (— 0.3%; — 1.7% year on year) and those of milk, cheese and eggs (— 0.3%; — 0.8% year on year) were still falling.
New rise in prices of petroleum products
In September 2013, energy prices grew by 0.8% (+ 0.7% year on year). This growth came from a new rise in prices of petroleum products (+ 1.4% ; — 2.5 % year on year). The prices of heating fuels increased much more in September 2013 (+ 2.6%, — 4.3% year on year) than those of motor fuels (+ 1.2%; — 2.5% year on year). City gas prices declined slightly in September 2013 (— 0.1%; + 2.9% year on year), while those of electricity were stable (+ 7.5% year on year)
Manufactured product prices rebounded in September at the end of summer sales
Prices of manufactured products increased by 1.3% in September 2013 (— 0.7% year on year) after + 1.1% in August 2013. With the end of the summer sales, prices of clothing and footwear increased by 7.2 % in September after +6.9% in August. However, their annual rate of change remained rather weak (+ 0.9%). Like in September 2012, the largest increases in clothing and footwear prices came from outwear for women (+ 15.6% in September; + 0.5% year on year) and for children (+ 9.2%; — 0.9% year on year) as well as from articles of lingerie and hosiery for women (+ 7.1% in September, + 0.4% year on year). After the summer sales, the prices of jewellery, clocks and watches (+ 0.7% between August and September this year ; + 1.0% year on year) and those of travel goods (+ 0.7% ; +1.8% year on year), have also strengthened in September. Moreover, in a seasonally manner, the prices of flowers and plants rose in September (+ 6.6% between August and September; + 0.5% year on year), as well as magazine prices (+ 4.5%; + 2.5% year on year). Conversely, due to promotions, the prices of new cars dropped in September (— 1.1%; + 0.3% year on year).
Core inflation remained steady in September
In September 2013, the core inflation indicator (ISJ) was stable : its annual rate of change stood by 0.6% like in July and August 2013. The Harmonised Index of Consumer Prices (HICP) declined by 0,2% in September 2013; it increased by 1,0% compared with the same month one year ago, like in August 2013.
Pour en savoir plus
