


 25 November 2013
2013- n° 267In November 2013, the business climate still declines in the retail trade and in
the trade and repair of motor vehicles Monthly survey of retailing - November 2013
25 November 2013
2013- n° 267In November 2013, the business climate still declines in the retail trade and in
the trade and repair of motor vehicles Monthly survey of retailing - November 2013
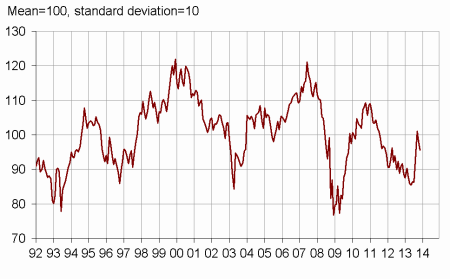
According to the managers, the business climate still declines in November 2013 in the retail trade and in the trade and repair of motor vehicles: the composite indicator reached again the level of August 2013, under its long-term average, but much above its last low point of May 2013.
According to the managers, the business climate still declines in November 2013 in the retail trade and in the trade and repair of motor vehicles: the composite indicator reached again the level of August 2013, under its long-term average, but much above its last low point of May 2013.
graphiquegraph_indsynt_en – Business climate synthetic indicator
Past and previous activities stabilized
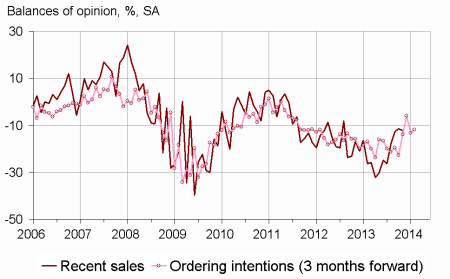
According to the business leaders, past and previous activity have not changed significantly: each of the three balances concerning past and expected sales and ordering intentions stabilizes under its mean level. The general business outlook dropped, sign that the managers are still pessimistic about the economic situation in the trade sector.
The business leaders considered that their stocks were a little lighter, under the standard level.
The balances concerning past and expected prices stabilized near their averages.
Cash position is still estimated as difficult.
graphiqueGraph_ventes_ic_en – Recent sales and ordering intentions
tableautab1_en – Global data
| Ave. (1) | Aug. 13 | Sept. 3 | Oct. 13 | Nov. 13 | |
|---|---|---|---|---|---|
| Business climate | 100 | 95 | 101 | 98 | 95 |
| General business outlook | –30 | –36 | –31 | –29 | –37 |
| Recent sales | –7 | –18 | –13 | –12 | –12 |
| Expected sales | –3 | –10 | –3 | –10 | –10 |
| Ordering intentions | –9 | –14 | –6 | –13 | –12 |
| Stocks | 11 | 7 | 5 | 10 | 8 |
| Past selling prices (2) | –6 | –6 | –7 | ||
| Expected selling prices | –3 | –4 | –1 | –5 | –4 |
| Cash position (2) | –15 | –23 | –25 | ||
| Workforce size: recent trend | 0 | –7 | –10 | –8 | –7 |
| Workforce size: future trend | –2 | –9 | –6 | –5 | –10 |
- (1) Average since 1991 (2004 for recent and expected sales and ordering intentions).
- (2) Bi-monthly question (odd-numbered months).
- Source: monthly survey in the retail trade and in the trade and repair of motor vehicles - INSEE
Expected employment decreased
According to the business managers, employment stabilized over the last few months, and will decrease over the next few months.
Retail trade
Lesser decline of past activity in specialized trade
According to the retailers, recent sales fell back in non-specialized trade. In specialized trade, less retailers than in October declared a decrease in their past activity: the corresponding balance has progressed for six months. In both sectors, balances are under their averages.
In the retail trade, forecasts remained dull: each of the two balances concerning expected sales and ordering intentions does not changed significantly and remains under its average.
Stocks were estimated lighter, near their standard level.
The past selling prices balance remains stable, the expected prices goes down slightly.
Cash-flow situation was still declared difficult, almost in specialized trade.
Trade and repair of motor vehicles
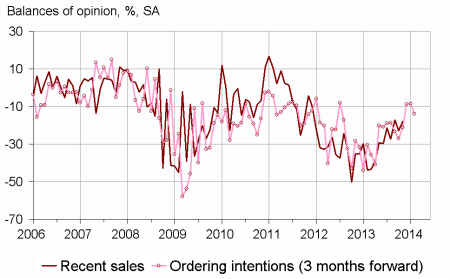
graphiquegraph_ventes_ic_auto_en – Recent sales and ordering intentions in motor vehicles
Average forecasts
The vehicle traders were a little less pessimistic about their past activity, but the corresponding balance remains under its mean level. Expected sales stabilized and ordering intentions declined, each of both balances being now near its average.
The level of stocks was considered stable, still under the standard level.
More managers than in September declared a fall in selling prices on the last months. Less than in October declared a fall in the next few months.
The cash position is declared more difficult than in September.
tableautab2_en – Detailed data
| Moy. (1) | Aug. 13 | Sept. 3 | Oct. 13 | Nov. 13 | |
|---|---|---|---|---|---|
| Retail trade - Global data | |||||
| Recent sales | –5 | –14 | –11 | –7 | –10 |
| Expected sales | 0 | –6 | –3 | –9 | –11 |
| Ordering intentions | –7 | –11 | –4 | –15 | –12 |
| Stocks | 10 | 5 | 2 | 11 | 9 |
| Past selling prices (2) | –7 | –7 | –7 | ||
| Expected selling prices | –4 | –4 | –1 | –4 | –6 |
| Cash position (2) | –13 | –21 | –22 | ||
| Workforce size: recent trend | 1 | –4 | –6 | –4 | –5 |
| Workforce size: future trend | –2 | –7 | –4 | –4 | –10 |
| Non-specialized retail trade | |||||
| Recent sales | –1 | –5 | –1 | 5 | –4 |
| Expected sales | 6 | 6 | 7 | 4 | 2 |
| Ordering intentions | 2 | –3 | 11 | –5 | 0 |
| Stocks | 7 | 4 | 4 | 10 | 5 |
| Past selling prices (2) | –7 | –2 | –2 | ||
| Expected selling prices | –4 | –8 | 2 | 2 | –5 |
| Cash position (2) | –7 | –6 | –10 | ||
| Specialized retail trade | |||||
| Recent sales | –9 | –25 | –22 | –21 | –16 |
| Expected sales | –7 | –19 | –12 | –19 | –20 |
| Ordering intentions | –17 | –19 | –23 | –20 | –19 |
| Stocks | 14 | 7 | 1 | 12 | 14 |
| Past selling prices (2) | –8 | –12 | –12 | ||
| Expected selling prices | –4 | 1 | –4 | –12 | –7 |
| Cash position (2) | –22 | –37 | –37 | ||
| Trade and repair of motor cars and motorcycles | |||||
| Recent sales | –11 | –27 | –17 | –23 | –18 |
| Expected sales | –9 | –21 | –4 | –10 | –11 |
| Ordering intentions | –14 | –21 | –9 | –8 | –14 |
| Stocks | 16 | 12 | 10 | 7 | 6 |
| Past selling prices (2) | 1 | –4 | –6 | ||
| Expected selling prices | 5 | –3 | –1 | 0 | 1 |
| Cash position (2) | –26 | –28 | –30 | ||
| Workforce size: recent trend | –9 | –17 | –19 | –24 | –18 |
| Workforce size: future trend | –7 | –15 | –14 | –12 | –14 |
- (1) Average since 1991 (2003 for trade and repair of motor vehicles and 2004 for recent and expected sales and ordering intentions).
- (2) Bi-monthly question (odd-numbered months).
- Source: monthly survey in the retail trade and in the trade and repair of motor vehicles - INSEE
Documentation
Methodology (pdf,129 Ko)
Pour en savoir plus
