


 23 July 2013
2013- n° 171In july 2013, the business climate recovers slightly in services Monthly survey of services - July 2013
23 July 2013
2013- n° 171In july 2013, the business climate recovers slightly in services Monthly survey of services - July 2013
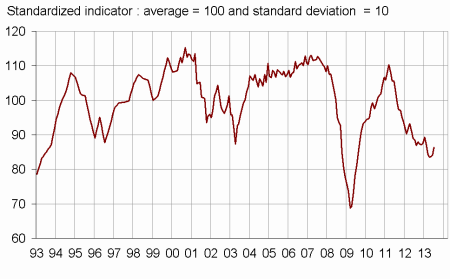
According to the business leaders surveyed in July 2013, the economic situation in services remained degraded but improved slightly. The business climate synthetic indicator rose by two points and is 86, well below its long-term average (100). The turning point indicator is consistent with a change in the economic situation’s dynamic, which has to be confirmed in the coming months. The general outlook recovered significantly but remained well below its long-term average. Business leaders consider that activity remained degraded over the recent period. They do not expect improvement in the three coming months.

Warning : seasonal coefficients were updated for this survey.
According to the business leaders surveyed in July 2013, the economic situation in services remained degraded but improved slightly. The business climate synthetic indicator rose by two points and is 86, well below its long-term average (100). The turning point indicator is consistent with a change in the economic situation’s dynamic, which has to be confirmed in the coming months. The general outlook recovered significantly but remained well below its long-term average. Business leaders consider that activity remained degraded over the recent period. They do not expect improvement in the three coming months.
They consider that their operating balance result was less damaged over the last few months, but remained pessimistic about the coming months.
In services except temporary employment agencies, business leaders remained pessimistic in their expectations for recruitment. In contrast, the investment outlook recovered, nearly reaching its long-term average.
graphiqueGraph1 – Composite indicator
graphiquegraph_retourn – Turning point indicator
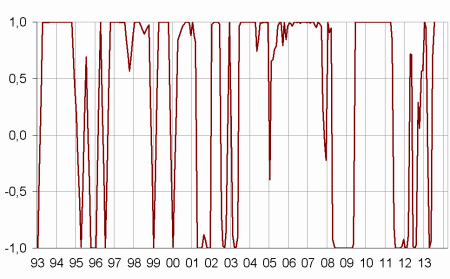
- Note: close to 1 (respectively -1), this indicator indicates a favourable short-term economic situation (respectively unfavourable).
tableauTable_quarter – Economic outlook in the services sector
| Average* | April 13 | May 13 | June 13 | July 13 | |
|---|---|---|---|---|---|
| Composite indicator | 100 | 84 | 84 | 84 | 86 |
| General outlook | –7 | –29 | –29 | –27 | –23 |
| Past activity | 3 | –16 | –16 | –12 | –17 |
| Expected activity | 3 | –16 | –11 | –14 | –14 |
| Expected demand | 0 | –16 | –17 | –16 | –12 |
| Business situation | –2 | –17 | –18 | –16 | –14 |
| Past selling prices | –3 | –14 | –12 | –12 | –12 |
| Expected selling prices | –2 | –12 | –12 | –12 | –13 |
| Past employment | 3 | –13 | –6 | –5 | –6 |
| except temporary work agencies | 1 | –12 | –5 | –8 | –5 |
| Expected employment | 2 | –15 | –13 | –8 | –7 |
| except temporary work agencies | 0 | –12 | –14 | –10 | –10 |
| Investments | |||||
| Past investments | 2 | –7 | –4 | –4 | –6 |
| Expected investments | 1 | –5 | –5 | –5 | 0 |
| Operating balance result | |||||
| Past result | –1 | –14 | –8 | ||
| Expected result | –1 | –15 | –16 | ||
| Cash position | –11 | –15 | –16 | ||
| Difficulties of supply and demand | |||||
| difficulties of supply and demand | 10 | 12 | 13 | ||
| difficulties of supply only | 22 | 19 | 16 | ||
| difficulties of demand only | 31 | 41 | 41 | ||
| Difficulties in recruitment | 29 | 20 | 16 |
- * Average of the balances of opinion since 1988
- Source: Insee
Documentation
Methodology (2016) (pdf,158 Ko)
Pour en savoir plus
Time series : Economic outlook surveys – Services
