


 31 July 2014
2014- n° 182Overall producer prices of agricultural products decreased in June Indices of agricultural prices - juin 2014
31 July 2014
2014- n° 182Overall producer prices of agricultural products decreased in June Indices of agricultural prices - juin 2014
In June, overall agricultural producer prices dropped by 1.1 % compared to May; over one year they fell by 5.0 %.
In June, overall agricultural producer prices dropped by 1.1 % compared to May; over one year they fell by 5.0 %.
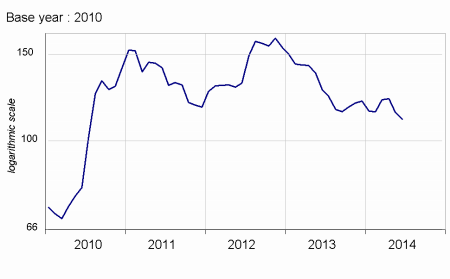
In June, cereal prices showed a drop by almost 9 % over one quarter (-13 % over one year), still as a result of abundant availabilities. The French maïze noticeably faced the Ukrainian competition. In addition, the significant crop ahead weighed on prices.
graphiquecereal – Producer prices of cereals
- Source : Insee
Oleaginous prices decreased in June (–4.8 %), due to a significant crop that was expected all over Europe
Overall prices of wines increased by 15 % over one year (and by 22.9 % for PDO wines), further to the drop in crops for the last two years.
Potato prices tumbled compared to last year (-48.5 %). This was a return to normal as the last but one crop, in 2012, had been particularly weak in North-Western Europe.
Fresh fruits prices plumeted year-over-year (–20.1 %). Indeed, apricots, cherries and peaches massively came on the stalls: their productions were far larger than last year, which was marked by bad weather conditions.
graphiquevegetable – Producer prices of vegetables
Fresh vegetables prices went down year-over-year (–10.3 %). On the supply side, cucumbers, courgettes and melons wre more abundant than last year at the same period ; bad weather conditions had led to drops in yields. On the demand side the consumers appreciated the tomatoes due to a summer-like weather ; as a result its price increased.
graphiquepig – Producer prices of pigs and large cattle
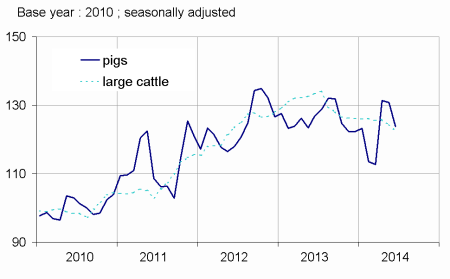
On a seasonally adjusted basis, animal prices decreased in June (-2.2 %), including pigs prices. Indeed, the Russian embargo on European pigs limited the exportation outlets. Big cattle prices decreased by almost 8 % over one year, as it reflected an eroding consumption.
tableauTab1 – Indices of producer prices of agricultural products (IPPAP)
| Variation as % over | |||||
|---|---|---|---|---|---|
| weights | june 2014 | a month | 3 months | a year | |
| raw | Seasonally adjusted | raw | |||
| Agricultural goods output | 1000 | 116.4 | –1.1 | –2.6 | –5.0 |
| excluding fruits and vegetables | 900 | 118.6 | –1.5 | –2.8 | –4.2 |
| Crop output (excluding fruits and vegetables) | 503 | 118.1 | –1.9 | –4.4 | –6.7 |
| Cereals | 188 | 110.7 | –3.0 | –8.9 | –13.0 |
| of which soft wheat | 112 | 109.8 | –4.5 | –11.5 | –10.3 |
| grain maize | 41 | 101.1 | –1.2 | –7.1 | –24.4 |
| Potatoes | 26 | 114.1 | /// | /// | –48.5 |
| Wines | 177 | 134.1 | +0.3 | +1.8 | +15.0 |
| Protected designation of origin | 84 | 146.1 | –0.7 | +2.0 | +22.9 |
| other wines | 23 | 138.5 | +5.2 | +5.1 | +12.8 |
| Oleaginous | 49 | 94.7 | –4.8 | –11.8 | –21.8 |
| Horticultural products | 30 | 105.2 | +0.8 | +2.7 | +1.5 |
| Other crop products | 33 | 124.6 | –0.6 | –1.6 | –5.2 |
| Fruits and vegetables (1) | 100 | 97.1 | /// | /// | –13.1 |
| Fresh vegetables | 53 | 93.8 | /// | /// | –10.3 |
| Fresh fruits | 35 | 97.6 | /// | /// | –20.1 |
| Animal output | 397 | 119.1 | –1.1 | –0.6 | –0.9 |
| Animals | 235 | 119.9 | –2.2 | +0.8 | –5.0 |
| of which large cattle | 96 | 122.5 | –1.4 | –2.4 | –7.9 |
| calves | 26 | 109.3 | –2.2 | –5.2 | +1.4 |
| pigs | 54 | 126.0 | –5.4 | +9.9 | –2.4 |
| sheep | 10 | 117.2 | –2.3 | +5.9 | +3.7 |
| poultry | 46 | 115.3 | +0.1 | 0.0 | –6.5 |
| of which chicken | 28 | 115.4 | +0.1 | +0.1 | –6.7 |
| Milk | 147 | 118.5 | 0.0 | –2.7 | +4.6 |
| of which cow milk (2) | 137 | 119.8 | 0.0 | –2.9 | +4.7 |
| Eggs | 15 | 113.6 | +7.8 | –1.4 | +18.5 |
- (1) Including vegetables for industry.
- (2) The price for June is not yet known and therefore is estimated by carrying forward the seasonally adjusted price from May
- Sources: Insee - SSP (ministry of agriculture)
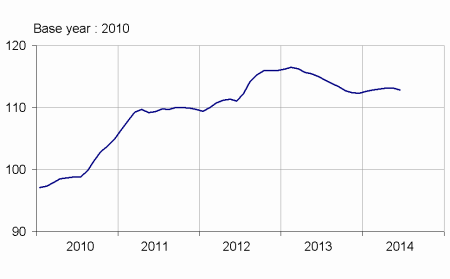
Purchase prices of the means of agricultural production were almost stable in June.
Overall prices of intermediate consumptions went down in June (-0.3 %). Over one year, animal feed and fertilisers prices respectively decreased by roughly 7% and 5%. Investments prices were stable in June.
graphiquemeans – Purchase price of the means of agricultural production
tableauTab2 – Indices of purchase prices of the means of agricultural production (IPAMPA)
| weights | June 2014 | Variation as % over | |||
|---|---|---|---|---|---|
| a month | 3 months | a year | |||
| Total input | 1000 | 112.9 | –0.2 | –0.1 | –1.8 |
| Intermediate consumptions | 764 | 114.8 | –0.3 | –0.1 | –2.6 |
| Energy | 100 | 117.5 | +1.2 | +0.4 | –0.3 |
| Seeds | 57 | 108.4 | –0.6 | –0.5 | +0.1 |
| Fertilisers and soil improvers | 92 | 116.6 | –2.4 | –1.4 | –5.5 |
| Plant protection products | 78 | 101.5 | 0.0 | +0.9 | +0.7 |
| Animal feed | 205 | 125.6 | –0.5 | –0.4 | –7.1 |
| Veterinary expenses | 43 | 111.4 | +0.3 | +0.7 | +2.5 |
| Small equipment and tools | 17 | 108.6 | +0.8 | +0.3 | –0.3 |
| Maintenance of materials | 67 | 111.3 | +0.1 | +0.1 | +2.5 |
| Maintenance of buildings | 9 | 106.7 | –0.1 | –0.1 | –0.3 |
| Other goods and services | 97 | 101.8 | 0.0 | 0.0 | 0.0 |
| Goods and services contributing to investment | 236 | 107.0 | 0.0 | –0.1 | +0.9 |
| Material | 186 | 107.0 | +0.1 | –0.1 | +1.5 |
| Tractors | 79 | 106.9 | –0.4 | –0.7 | +1.1 |
| Machinery and plant for cultivation | 36 | 108.3 | +0.8 | +0.5 | +2.9 |
| Machinery and plant for harvesting | 42 | 107.5 | +0.5 | +0.5 | +1.2 |
| Utility vehicles | 18 | 104.4 | –0.1 | –0.8 | +1.5 |
| Buildings | 50 | 106.9 | –0.1 | +0.2 | –1.0 |
- (1) The repayment of the domestic tax on energy products (TICPE) benefiting farmers has been applied in advance for the year 2014
- Sources: Insee - SSP (ministry of agriculture)
Documentation
Methodology (pdf,122 Ko)
Pour en savoir plus
Time series : Indices of agricultural prices
