


 27 September 2013
2013- n° 221Households consumption of goods in August got back to its level of June (+0.4% in
July then -0.4% in August) Household consumption expenditure on goods - July-August 2013
27 September 2013
2013- n° 221Households consumption of goods in August got back to its level of June (+0.4% in
July then -0.4% in August) Household consumption expenditure on goods - July-August 2013
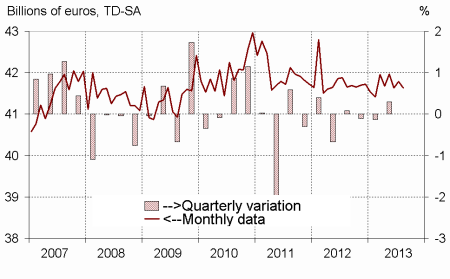
In August, households expenditure on goods decreased by 0.4% in volume*, after a 0.4% increase in July. The recovery of expenditure on cars and of consumption of food products contributed to the raise in July. The decline in August was mainly attributable to a renewed decrease in the consumption of food and energy products.
In August, households expenditure on goods decreased by 0.4% in volume*, after a 0.4% increase in July. The recovery of expenditure on cars and of consumption of food products contributed to the raise in July. The decline in August was mainly attributable to a renewed decrease in the consumption of food and energy products.
Engineered goods : slightly increasing
Durables: increasing in July, slightly decreasing in August
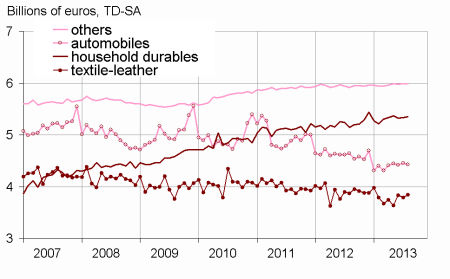
After a decline in June (–0.8%), households expenditure on durable goods rose in July (+0.7%) then slightly decreased in August (–0.3%).This outline ensued mainly from the expenditure on cars (+0.9% in July followed with -0.7% in August). As for purchases in household durables, they picked up slightly this summer (+0.4% in August after +0.1% in July) after a decrease in June (–0.8%).
Textile-leather: August at June level
After a significant raise in June (+5.4%), mainly attributable to the summer sales period, households consumption of textile and leather weakened in July (–1.2%), then bounced in August (+1.3%) back to its June level.
Other engineered goods: slightly increasing
After a decline in June (–0.3%), consumption expenditure on other engineered goods slightly increased in July (+0.2%) then stabilized in August, mainly in hardware consumption.
[* Volumes are chained and all figures are trading days and seasonally adjusted.]
graphiquegraph1_new_ang – Total consumption of goods
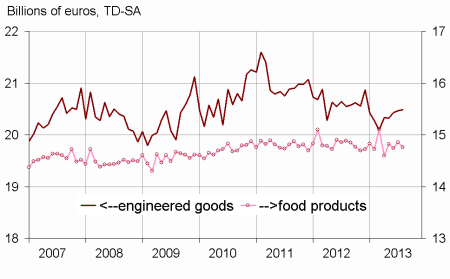
graphiquegraph2_new_ang – Food and engineered goods
graphiquegraph3_new_ang – Decomposition of engineered goods
Food products: bounce in July, decrease in August
After a decline in June ( –0.5%), particularly in expenditure on tobacco, consumption of food products recovered in July (+0.7%) then decreased anew in August (–0.7%).
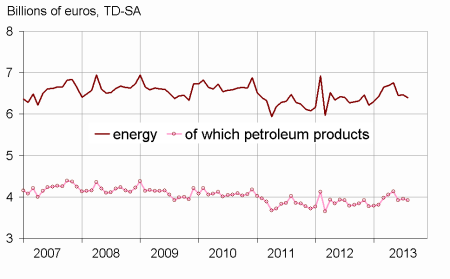
Energy: decrease in August
After a sharp fall in June (–4.5%), households consumption of energy products slightly increased in July (+0.2%), an increase that was mainly due to a rebound in the expenditure on fuel. Then, consumption of energy went down again in August (–1.0%), which reflected the return to a normal level of gas and electricity consumption.
The decrease in June is confirmed
The evolution in consumption of goods is still estimated at –0.8% in June, as it was for the previous publication. Some minor revisions offset each other. They are mainly due to the integration of new information (particularly the integration of VAT indexes for expenditure in car equipments), to the revision of indexes (notably regarding consumption of textile), as well as to the updating of the seasonal adjustment coefficients.
| June | July | August | August 13/ | |
|---|---|---|---|---|
| 2013 | 2013 | 2013 | August 12 | |
| Food products | 14.744 | 14.853 | 14.754 | |
| Change (%) | –0.5 | 0.7 | –0.7 | –0.9 |
| Engineered goods | 20.433 | 20.467 | 20.488 | |
| Change (%) | 0.6 | 0.2 | 0.1 | –0.3 |
| Of which: | ||||
| Automobiles | 4.414 | 4.453 | 4.423 | |
| Change (%) | –0.7 | 0.9 | –0.7 | –4.8 |
| Household durables | 5.323 | 5.329 | 5.351 | |
| Change (%) | –0.8 | 0.1 | 0.4 | 4.1 |
| Textile-leather | 3.836 | 3.791 | 3.841 | |
| Change (%) | 5.4 | –1.2 | 1.3 | –0.8 |
| Other engineered goods | 5.973 | 5.988 | 5.987 | |
| Change (%) | –0.3 | 0.2 | 0.0 | 1.2 |
| Energy | 6.449 | 6.464 | 6.402 | |
| Change (%) | –4.5 | 0.2 | –1.0 | 2.1 |
| Including petroleum products | 3.919 | 3.956 | 3.924 | |
| Change (%) | –5.1 | 0.9 | –0.8 | 3.8 |
| Total | 41,628 | 41,791 | 41,631 | |
| Change (%) | –0.8 | 0.4 | –0.4 | –0.1 |
| Manufactured goods | 35,897 | 36,113 | 35,996 | |
| Change (%) | –0.5 | 0.6 | –0.3 | –0.1 |
graphiquegraph4_new_ang – Energy
graphiquetab1_eng – Households consumption expenditures on goods
Documentation
Methodology (pdf,23 Ko)
Pour en savoir plus
