


 11 July 2013
2013- n° 161The Consumer Prices Index increased by 0.2% in June 2013; it rose by 0.9% year-on-year Consumer price index - final results - June 2013
11 July 2013
2013- n° 161The Consumer Prices Index increased by 0.2% in June 2013; it rose by 0.9% year-on-year Consumer price index - final results - June 2013
After rising by 0.1% in May, the Consumer Price Index (CPI) increased by 0.2% in June 2013. Between June 2012 and June 2013, it grew by 0.9% (+ 0.8% year on year in May 2013 and + 0.7% in April 2013). Excluding tobacco, the CPI went up also by 0.2% in June (+0.8% year on year). Seasonally adjusted, the CPI rose also by 0.2% (+0.9% year on year, after +0.8% in May). The largest upward contributions to the change in the monthly rate of the CPI came from the rises, partly seasonal, in prices of certain services and in food prices. The energy prices and those of manufactured goods remained broadly unchanged in June.
Monthly change: +0.2%; Year on year: +0.9%
After rising by 0.1% in May, the Consumer Price Index (CPI) increased by 0.2% in June 2013. Between June 2012 and June 2013, it grew by 0.9% (+ 0.8% year on year in May 2013 and + 0.7% in April 2013). Excluding tobacco, the CPI went up also by 0.2% in June (+0.8% year on year). Seasonally adjusted, the CPI rose also by 0.2% (+0.9% year on year, after +0.8% in May). The largest upward contributions to the change in the monthly rate of the CPI came from the rises, partly seasonal, in prices of certain services and in food prices. The energy prices and those of manufactured goods remained broadly unchanged in June.
Prices of services increased in June
In June 2013, service prices rose by 0.2%, due to seasonal price increases at the beginning of the summer holidays. Between June 2012 and June 2013, they grew by 1.0% down from +1.1% year on year in May 2013. Thus, the prices of accommodation services went up by 5.5% in June 2013 (+4.5% in June 2012) and by 1.4% year on year. Similarly, rentals for holiday residences were up 2.5% in June 2013 (+3.2% in June 2012). This has been the same thing for air fares, their monthly growth rate was however lesser in June this year (+1.1%) than in June last year (+5.5%). On the contrary, as usual in June, the prices of package holidays has fallen (—11.2% in June 2013; —12.5% in June 2012). Moreover, after a rebound in May, telecommunication prices increased again slightly in June (+0.3% after +1.3% in May), due to a rise in fixed telephone subscription rates. Between June 2012 and June 2013, prices of telecommunication services have still declined sharply (—13.3%). Finally, the prices of health services rose slightly in June (+0.1%) but their annual rate of change has slowed down, from +1.2% in May 2013 to +1.1% in June 2013.
tableauOLE_LINK2 – Detailed figures for various groups
| Items | Weight 2013 | Index June 2013 | Month rate (%) | Annual rate (%) |
|---|---|---|---|---|
| a) All households - France | ||||
| All items (00 E) | 10000 | 127,52 | 0,2 | 0,9 |
| All items SA (00 C) | 10000 | 127,17 | 0,2 | 0,9 |
| Food (4000 E) | 1658 | 134,21 | 0,4 | 1,8 |
| Fresh food (4001 E) | 210 | 157,32 | 2,5 | 7,3 |
| Food excluding fresh products (4002 E) | 1448 | 131,03 | 0,1 | 1,0 |
| Tobacco (4034 E) | 206 | 241,79 | 0,0 | 7,0 |
| MANUFACTURED PRODUCTS (4003 E) | 2738 | 101,85 | 0,0 | –0,4 |
| Clothing and footwear (4004 E) | 458 | 111,94 | 0,2 | 1,0 |
| Medical products (4005 E) | 455 | 80,64 | –0,1 | –3,3 |
| Other manufactured products (4006 E) | 1825 | 104,72 | –0,1 | –0,1 |
| ENERGY (4007 E) | 822 | 176,80 | 0,0 | 1,7 |
| Petroleum products (4008 E) | 495 | 204,96 | 0,1 | –0,9 |
| SERVICES (4009 E) | 4576 | 133,62 | 0,2 | 1,0 |
| Actual rentals and services for dwellings (4010 E) | 748 | 139,39 | 0,1 | 1,7 |
| Medical services (4011 E) | 542 | 122,16 | 0,1 | 1,1 |
| Transport and communication services (4012 E) | 506 | 94,65 | 0,4 | –5,8 |
| Other services (4013 E) | 2780 | 143,67 | 0,3 | 2,1 |
| ALL ITEMS EXCLUDING RENTALS AND TOBACCO (5000 E) | 9202 | 125,21 | 0,2 | 0,8 |
| ALL ITEMS EXCLUDING TOBACCO (4018 E) | 9794 | 125,78 | 0,2 | 0,8 |
| b) Manual or clerical worker headed urban households - France | ||||
| ALL ITEMS EXCLUDING TOBACCO (4018 D) | 9704 | 125,58 | 0,2 | 0,8 |
| ALL ITEMS (00 D) | 10000 | 128,13 | 0,2 | 0,9 |
| c) Households that belong to the lowest equivalized disposable income quintile - France | ||||
| ALL ITEMS EXCLUDING TOBACCO (4018 Q) | 9674 | 126,95 | 0,2 | 0,7 |
- Source : Insee - Consumer Price Indeces
tableauTableau1English – Detailed figures for Core inflation* and HICP**
| Percentage change | ||||
|---|---|---|---|---|
| Items | Weight 2013 | Index June 2013 | Month rate | Annual rate |
| All items "Core inflation" (4022 S) | 6085 | 122,11 | 0,0 | 0,3 |
| Food excluding fresh products, meat, milk and exotic products (4019 S) | 715 | 126,16 | 0,1 | 0,3 |
| Manufactured products (4020 S) | 2217 | 105,73 | 0,0 | 0,1 |
| Services including actual rentals and services for dwellings (4021 S) | 3153 | 137,42 | 0,1 | 0,5 |
| All items HICP (00 H) | 115,18 | 0,2 | 1,0 | |
- * ISJ : Core inflation indicator excludes public sector prices, the most volatile consumer prices and the tax measures. This index is seasonally adjusted. This index is calculated for all households in France excluding overseas departments and territories (base 100 1998).
- **HICP : Harmonised Indices of Consumer Prices are inflation figures required under the Treaty on the functioning of the European Union. They are designed for international comparison of consumer price inflation between Member states of the Union. This index is calculated for all households in France (base 100 2005).
- Source : Insee - Consumer Price Indeces
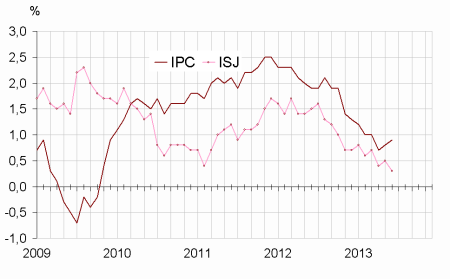
graphiqueGraphique1English – Consumer price index (IPC) and Core inflation (ISJ) –annual rates of change
- Source : Insee - Consumer Price Indeces
The fresh foodstuff prices increased in June
In June 2013, food prices increased by 0.4% and by 1.8% year on year (like in May 2013). The upward pressures came mainly from large seasonal increases in prices of fresh foodstuff (+2.5% in June 2013; +2.9% in June 2012). The impact of adverse weather conditions at the beginning of the year has remained also significant. Between June 2012 and June 2013, prices of fresh foodstuff grew by 7.3% (+7.7% in May 2013), those of fresh fruits by 8.3% and those of fresh vegetables by 8.0% in June 2013. Conversely, except the prices of meat (+0.1% in June 2013; +3.1% year on year like in May) and those of alcoholic beverages (+0.3% in June and +3.2% year on year), the prices of the other food products remained sluggish in June 2013. Excluding fresh foodstuff, the food prices rose by 0.1% in June and by 1.0% year on year (+0.9% in May).
Energy prices stabilized in June
After three consecutive months of decline, energy prices stabilized in June 2013. Year on year, they increased by 1.7% mainly as a result of the steep rises in electricity prices (+6.4% year on year in June 2013) and in city gas (+4.9% year on year). The prices of petroleum products went up slightly in June (+0.1%) but declined again year on year (—0.9%). In June 2013, motor fuel prices were lower by 1.4% compared one year earlier, and those of heating fuel by 0.2%.
Stable in June, the prices of the manufactured goods declined slightly, year on year
Like in May, the prices of manufactured products remained broadly stable in June 2013. Between June 2012 and June 2013, they declined by 0.4%, à little more than between May 2012 and May 2013 (—0.3%). Before the summer sales, the clothing and footwear prices changed a little, increasing by 0.2% in June 2013 and by 1.0% year on year. After having been almost stable in May, the prices of health goods went down by 0.1% in June 2013 and fell by 3.3%, year on year (—3.5% in May 2013). Finally, because of promotions, the prices of the other manufactured products declined slightly again in June (—0.1% over a month; —0.1% year on year). This is the case for new car prices (—0.2% in June after —1.3% in May), for the prices of audio-visual, photographic and information processing equipment (—0.4% after —0.9% in May; —7.5% year on year) and for perfumes, care and beauty products (—0.4% in June after —0.2% in May; +0.8% year on year).
Core inflation remained stable in June
The core inflation indicator (ISJ) remained unchanged in June 2013 after an increase by 0.2% in May. Its annual rate of change declined to +0.3% in June, the lowest rate of this statistic (calculated from 1990). The Harmonized Index of Consumer Prices (HICP) was up 0.2% in June 2013 and by 1.0% year on year (+0.9% year on year in May 2013 and +0.8% in April 2013).
Pour en savoir plus
