


 24 December 2013
2013- n° 299In November, household consumption of goods picked up (+1.4%) because of a sharp rebound
in expenditure on energy products Household consumption expenditure on goods - November 2013
24 December 2013
2013- n° 299In November, household consumption of goods picked up (+1.4%) because of a sharp rebound
in expenditure on energy products Household consumption expenditure on goods - November 2013
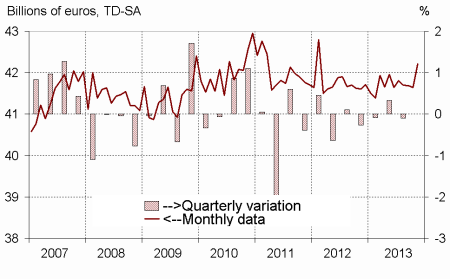
In November, household expenditure on goods increased by 1.4 % in volume*, after decreasing by 0.1% in October. This increase was mainly due to a decrease in expenditure on energy products (+7.5%). Expenditure on engineered goods have been increasing continuously since June.
In November, household expenditure on goods increased by 1.4 % in volume*, after decreasing by 0.1% in October. This increase was mainly due to a decrease in expenditure on energy products (+7.5%). Expenditure on engineered goods have been increasing continuously since June.
Engineered goods : increasing again
Durables : slighlty decreasing
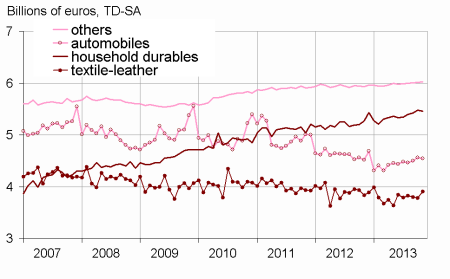
Household expenditure on durables weakened in November (-0.3%), after a 1.1% increase in October. This was attributable to a decrease in car purchases (-0.4%, after +1.4%) and in household durables (-0.3% after +0.9%). In total, consumption of durables increased by 1.7% compared to November 2012.
Textile-leather : rebound
In November, purchases on clothing, textile and leather bounced back (+3.3% after -0.4%). Cold temperatures may have been favourable to fall-winter clothing purchases. This rebound and the main driver of the engineered goods increase in November (+0.5% as in October).
Other engineered goods : slightly increasing
Consumption expenditure on other engineered goods slowed slightly in November (+0.1% after +0.2% in October), especially in purchases on hardware.
[* Volumes are chained and all figures are trading days and seasonlly adjusted.]
graphiquegraph1_new_ang – Total consumption of goods
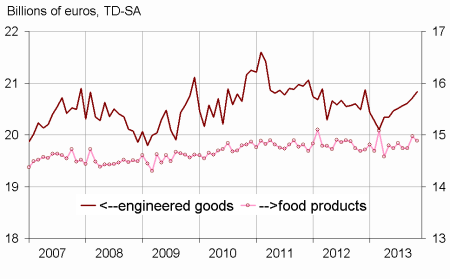
graphiquegraph2_new_ang – Food and engineered goods
graphiquegraph3_new_ang – Decomposition of engineered goods
After an increase in October (+1.5%), consumption in food products fell again in November (-0.6%), notably consumption on tobacco products.
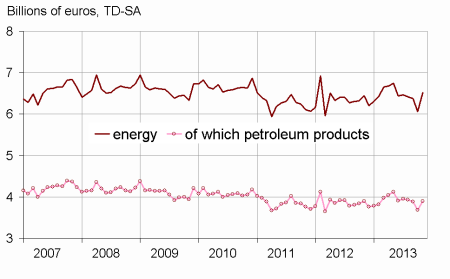
Energy : sharply increasing
After a sharp decrease in October due to above average temperatures (–4.9%), household consumption of energy products bounced in November (+7.5%), which reflected this time the impact of below average temperatures on heating expenditure (electricity, gas, heating oil). However, motor fuel expenditure decreased.
The decrease in September is less significant
The decrease of household consumption on goods is revised down to -0.1% against -0.2% for the previous publication. This minor revision come from the integration of new information, in particular in electronic products, and from the updating of seasonal adjustment models.
tableau – Households consumption expenditures on goods
| Sept. | Oct. | Nov. | Nov.13/ | |
|---|---|---|---|---|
| 2013 | 2013 | 2013 | Nov.12 | |
| Food products | 14.744 | 14.971 | 14.882 | |
| Change (%) | 0.0 | 1.5 | –0.6 | 1.3 |
| Engineered goods | 20.607 | 20.719 | 20.831 | |
| Change (%) | 0.2 | 0.5 | 0.5 | 1.7 |
| Durables | 10.815 | 10.935 | 10.905 | |
| Change (%) | 0.7 | 1.1 | –0.3 | 1.7 |
| - of which automobiles | 4.499 | 4.561 | 4.542 | |
| Change (%) | 0.8 | 1.4 | –0.4 | 0.5 |
| - of which household durables | 5.424 | 5.473 | 5.457 | |
| Change (%) | 0.5 | 0.9 | –0.3 | 3.5 |
| Textile-leather | 3.796 | 3.782 | 3.905 | |
| Change (%) | –0.8 | –0.4 | 3.3 | 1.8 |
| Other engineered goods | 6.003 | 6.017 | 6.026 | |
| Change (%) | 0.2 | 0.2 | 0.1 | 1.5 |
| Energy | 6.373 | 6.062 | 6.519 | |
| Change (%) | –0.7 | –4.9 | 7.5 | 1.1 |
| Petroleum products | 3.887 | 3.686 | 3.900 | |
| Change (%) | –1.0 | –5.2 | 5.8 | 0.0 |
| Total | 41.691 | 41.647 | 42.216 | |
| Change (%) | 0.0 | –0.1 | 1.4 | 1.5 |
| Manufactured goods | 36.032 | 36.323 | 36.373 | |
| Change (%) | –0.1 | 0.8 | 0.1 | 1.3 |
graphiquegraph4_new_ang – Energy
Documentation
Methodology (pdf,23 Ko)
Pour en savoir plus
