


Quarterly national accounts in Q1 2014 National accounts in base 2010 - Detailed results
In 2014 Q1, French GDP held steady Quarterly national accounts - second estimate - 1st quarter 2014
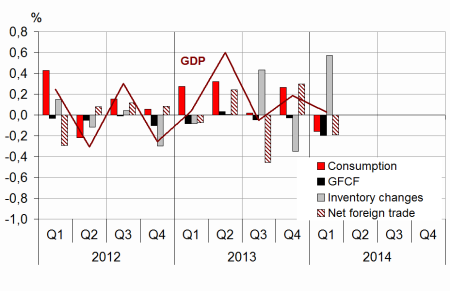
In Q1 2014*, French gross domestic product (GDP) in volume** levelled off (0.0%) after a small increase in Q4 (+0.2%).
In Q1 2014*, French gross domestic product (GDP) in volume** levelled off (0.0%) after a small increase in Q4 (+0.2%).
In the three first months of 2014, household consumption expenditure decreased (–0.5% after +0.2%) and the gross fixed capital formation (GFCF) declined more sharply (–0.9% after –0.1%). Overall, total domestic demand (excluding changes in inventories) dropped and contributed negatively to activity (–0.4 points after +0.2 points in Q4).
Imports accelerated (+1.0% after +0.5%), while exports slowed (+0.3% after +1.6%). Consequently, the foreign trade balance contributed negatively to GDP change (–0.2 points after +0.3 points in Q4). On the contrary, changes in inventories contribued positively (+0.6 points after –0.3 points the previous quarter).
Total production edged up
In Q1 2014, total production in goods and services increased by 0.2%, on the same trend as in Q4 2013. Output in the manufactured goods recovered (+1.0% after 0.0%), notably in « coke and refined petroleum ». At the same time, production in tradable services was slightly up (+0.3% after +0.4%). However construction declined (–1.5% after –0.3%). Similarly, production in « energy, water and waste » decreased again because of low heating expenditure.
Household consumption stepped this quarter
In Q1 2014, household consumption expenditure declined (–0.5% after +0.2%). Expenditure on food products fell (–0.9% after +0.8%), in particular on tobacco after the price increase in January. Total expenditure on energy declined for the third consecutive quarter, due to temperatures above their seasonal average. Similarly,
graphiqueGraph1 – GDP and its main components
tableauTab1 – Goods and services:supply and uses chain-linked volumes
| 2013 Q2 | 2013 Q3 | 2013 Q4 | 2014 Q1 | 2013 | 2014 (ovhg) | |
|---|---|---|---|---|---|---|
| GDP | 0.6 | -0.1 | 0.2 | 0.0 | 0.4 | 0.3 |
| Imports | 1.7 | 1.2 | 0.5 | 1.0 | 1.9 | 2.3 |
| Household consumption *expenditure | 0.2 | -0.1 | 0.2 | -0.5 | 0.3 | -0.3 |
| General government's *consumption expenditure | 0.8 | 0.3 | 0.5 | 0.4 | 2.0 | 1.2 |
| GFCF | 0.2 | -0.2 | -0.1 | -0.9 | -0.8 | -1.1 |
| *of which Non financial corporated and unincorporated enterprises | 0.5 | 0.2 | 0.8 | -0.5 | -0.6 | 0.3 |
| Households | -0.5 | -1.7 | -2.2 | -2.6 | -3.1 | -5.2 |
| General government | 0.1 | 0.6 | -0.3 | -0.2 | 1.1 | -0.1 |
| Exports | 2.7 | -0.4 | 1.6 | 0.3 | 2.4 | 2.0 |
| Contributions : | ||||||
| Internal demand excluding inventory changes | 0.4 | 0.0 | 0.2 | -0.4 | 0.5 | -0.1 |
| Inventory changes | 0.0 | 0.4 | -0.3 | 0.6 | -0.2 | 0.5 |
| Net foreign trade | 0.2 | -0.5 | 0.3 | -0.2 | 0.1 | -0.1 |
tableauTab2 – Sectoral accounts
| 2013 Q2 | 2013 Q3 | 2013 Q4 | 2014 Q1 | 2013 | 2014 (ovhg) | |
|---|---|---|---|---|---|---|
| Profit ratio of NFC* (level) | 30.1 | 29.5 | 29.5 | 29.8 | ||
| Household purchasing power | 0.3 | -0.2 | -0.3 | 0.0 | -0.2 |
- *NFC: non-financial corporations
tableauTab3 – Production, Consumption and GFCF: main components
| 2013 Q2 | 2013 Q3 | 2013 Q4 | 2014 Q1 | 2013 | 2014 (ovhg) | |
|---|---|---|---|---|---|---|
| Production of branches | 0.9 | -0.2 | 0.2 | 0.2 | 0.5 | 0.5 |
| Goods | 1.5 | -1.2 | -0.3 | 0.5 | -0.2 | 0.0 |
| Manufactured Industry | 1.7 | -1.2 | 0.0 | 1.0 | -0.6 | 0.8 |
| Construction | 0.4 | -0.5 | -0.3 | -1.5 | -1.2 | -1.8 |
| Market services | 0.7 | 0.2 | 0.4 | 0.3 | 0.9 | 0.9 |
| Non-market services | 0.7 | 0.2 | 0.4 | 0.5 | 1.5 | 1.0 |
| Household consumption | 0.2 | -0.1 | 0.2 | -0.5 | 0.3 | -0.3 |
| Food products | -0.8 | 0.3 | 0.8 | -0.9 | 0.1 | -0.3 |
| Énergy | 0.8 | -3.5 | -1.5 | -3.8 | 0.8 | -6.4 |
| Engineered goods | -0.1 | 0.7 | 1.3 | 0.0 | -1.0 | 1.3 |
| Services | 0.4 | 0.1 | 0.1 | 0.2 | 0.6 | 0.4 |
| GFCF | 0.2 | -0.2 | -0.1 | -0.9 | -0.8 | -1.1 |
| Manufactured goods | -0.7 | 1.2 | 0.4 | -0.4 | -0.9 | 0.3 |
| Construction | 0.0 | -0.8 | -0.7 | -1.8 | -1.6 | -2.7 |
| Services | 0.9 | -0.3 | 0.4 | 0.1 | 0.3 | 0.5 |
tableauTab4 – Households’ disposable income and ratios of households’ account
| 2013 Q2 | 2013 Q3 | 2013 Q4 | 2014 Q1 | 2013 | 2014 (ovhg) | |
|---|---|---|---|---|---|---|
| HDI | 0.3 | 0.0 | -0.2 | 0.6 | -0.1 | |
| Household purchasing power | 0.3 | -0.2 | -0.3 | 0.0 | -0.2 | |
| HDI by cu* (purchasing power) | 0.2 | -0.4 | -0.4 | -0.6 | -0.5 | |
| Adjusted HDI (purchasing power) | 0.4 | -0.1 | -0.1 | 0.5 | 0.0 | |
| Saving rate (level) | 15.2 | 15.1 | 14.7 | 15.1 | ||
| Financial saving rate (level) | 5.9 | 6.0 | 5.6 | 5.8 |
- *cu: consumption unit
tableauTab5 – Ratios of non-financial corporations’ account
| 2013 Q2 | 2013 Q3 | 2013 Q4 | 2014 Q1 | 2013 | |
|---|---|---|---|---|---|
| Profit share | 30,1 | 29,5 | 29,5 | 29,8 | |
| Investment ratio | 22,5 | 22,6 | 22,7 | 22,6 | |
| Savings ratio | 17,4 | 16,7 | 17,3 | 17,1 | |
| Self-financing ratio | 77,5 | 73,7 | 76,3 | 75,7 |
tableauTab6 – Expenditure, revenue and net borrowing of public administrations
| 2013 Q2 | 2013 Q3 | 2013 Q4 | 2014 Q1 | 2013 | |
|---|---|---|---|---|---|
| In billions of euros | |||||
| Total expenditure | 300.3 | 303.5 | 305.5 | 1208.3 | |
| Total revenue | 278.5 | 281.1 | 282.6 | 1118.7 | |
| Net lending (+) or borrowing (-) | -21.8 | -22.4 | -22.9 | -89.6 | |
| In % of GDP | |||||
| Net lending (+) or borrowing (-) | -4,1 | -4,2 | -4,3 | -4,2 |
car purchases dropped in Q1 2014 (-1.3%) after a dynamic Q4 2013 (+2.5%), as households anticipated a strenghtening of taxes on the purchase of cars from January 1st. Furthermore expenditure on services remained sluggish (+0.2% after +0.1%).
GFCF declined again
Total GFCF decreased in Q1, for the third consecutive quarter (–0.9% after –0.1% and –0.2%). In particular, investment in construction declined more sharply (–1.8% after –0.7%) and that in manufactured goods dipped (–0.4% after +0.4%). Expenditure on tradable services were contrasted : climbing in information and communication, but sliding in business services.
Exports slowed
In Q1 2014, exports decelerated (+0.3% after +1.6%), especially in manufactured goods (+0.4% after +1.8%). The slowdown resulted notably from the downturn in transport equipment (–1.0% after +3.9%). At the same time imports accelerated slightly (+1.0% after +0.5% at the end of 2013), in goods as in services. Thus foreign trade weighed down on GDP change this quarter : –0.2 points after +0.3 points.
Changes in inventories contributed positively
In Q1, changes in inventories contributed positively to GDP change : +0.6 points after –0.3 points at the end of 2013. This concerned particularly the coke and refined petroleum.
GDP growth, now estimated in “base 2010” is revised
Revisions are larger this quarter than the previous publications, but their magnitude is typical of the first quarter. They come from the benchmarking on annual account in year 2011 to 2013 and from the reestimation of calendar and seasonal adjustment models.
Furthermore, quarterly and annual national accounts switched to 2010 as the reference year (see File on insee.fr (in French) : « GDP level is reviewed by +3.2% in base 2010 »). If the level of the main aggregates has been significantly reviewed, revisions of quarter-on-quarter GDP growth are relatively small comparatively to the previous changes of base year. In Q4 2013, GDP increase is thus slightly reduced (–0.1 points to +0.2%).
Avertissement
Quarterly national accounts
Quarterly debt of the general government
Sources
Quarterly national accounts
Quarterly accounts are a consistent set of indicators which provides a global overview of recent economic activity.
Time series of the main aggregates of quarterly national accounts can be accessed through the "Summary". They are classified into eight categories:
- Gross domestic product (GDP) and main economic aggregates ;
- Goods and services ;
- Households' consumption ;
- Foreign trade ;
- Activities ;
- Institutional sectors ;
- Households' income and purchasing power ;
- Public finances.
For each category, are available :
- synthetic files displaying from the accounts the relevant information for economic analysis ,
- sometimes, one or two files displaying all the data available.
Documentation
Abbreviated methodology (pdf, 140 Ko )
Methodology - First estimate at 30 days (pdf, 112 Ko )