


 13 September 2013
2013- n° 211In August 2013, downturn in raw food material prices Prices of oil and raw material imports - August 2013
13 September 2013
2013- n° 211In August 2013, downturn in raw food material prices Prices of oil and raw material imports - August 2013
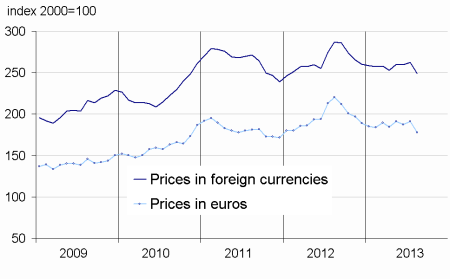
In August, the crude oil price in euro terms slightly increased (+0.5%), reaching € 82.7 per barrel of Brent. On the other hand, prices in euros terms of commodities except energy imported into France decreased (-1.5%) under the influence of an outstanding decrease in raw food materials (–6.8%) whereas prices of industrial raw materials rose again (+2,1% ).
In August, the crude oil price in euro terms slightly increased (+0.5%), reaching € 82.7 per barrel of Brent. On the other hand, prices in euros terms of commodities except energy imported into France decreased (-1.5%) under the influence of an outstanding decrease in raw food materials (–6.8%) whereas prices of industrial raw materials rose again (+2,1% ).
Slight increase in oil prices
In dollars terms, the price of crude oil from the North Sea (Brent) ramped up (+2.3% after +4.7% in July) and stood at $110.1 per barrel. In euros terms, the increase was less marked (+0.5% after +5.6%), due to an appreciation of the euro against the dollar (+1.8%).
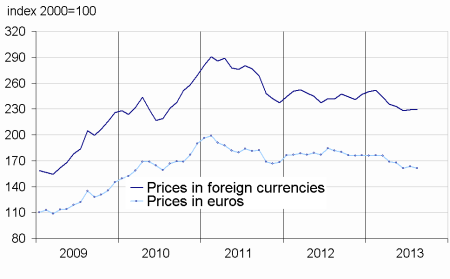
Increase in prices of imported industrial raw materials
In euros terms, prices of industrial raw materials increase (+2.1% after +0.9% in July). Prices of mineral raw materials rose again (+2.7% after +0.7% in July), especially because of a rise of the prices of iron ores (+5.9%) related to a strengthening of the Chinese demand. The prices of non-ferrous metals rose as well in August (+1.6% after -1.7%), particularly due to a rise in lead prices (+6.1%), copper and nickel (+4.2% both). Prices of precious metals notably rebounded (+4.7% after –3.3%), due to the unpredictable geopolitical situation in the Middle East. In particular, the price of silver, still viewed as a safe value, rose sharply (+8.9%) .The prices of platinum also increased (+4.7%) due to concerns regarding possible closing of South-African mines and a dynamic Chinese demand.
Prices of agro-industrial raw materials faintly increased (+0.4% after +1.6% in July). The relatively important increases in sawn softwood prices (+2.6%) and rubber (+4.7%) were compensated with the decreases in paper pulp (-1.9%) and natural textile fibres (-1.8% after -0.4%) prices.
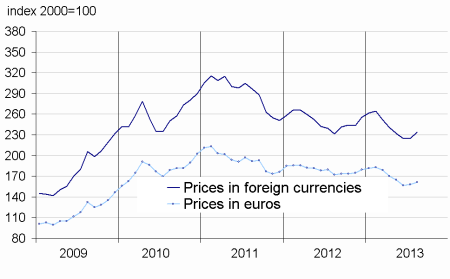
Prices of raw food materials went down sharply
Prices of raw food materials in euros terms significantly decreased (-6.8% after +2.0% in July). In particular, prices of oilseeds dropped (-12.5% after -4.1%), due to a good sunflower crop. Prices of cereals also decreased sharply (-12.1% after -4.3%). This decrease owed it to the prices of maize (-19,4%) due to abundant crops in the main producing countries (Argentina, Brazil, Europe, the U.S.). Prices of tropical foodstuff slowly rose (+0.8% after +2.1%). Prices of cocoa (+4.8%), sustained by a strong worldwide demand and adverse weather conditions threatening crops in Western Africa, rose. On the other hand, prices of Arabica (-5.9%) and Robusta (-2.6%) decreased. Brazil, the first Arabica-producing country, indeed had a particularly fruitful crop. The price of beef meat also declined (-2.1% after +0.3%).
tableautabpetrole – Oil and petroleum products
| Prices | Change (%) | |||
|---|---|---|---|---|
| of last month | over the last month | over the last 3 months | over the last 12 months | |
| Brent in $ per barrel | 110,1 | 2,3 | 6,9 | –2,0 |
| Brent in € per barrel | 82,7 | 0,5 | 4,2 | –8,7 |
| Gasoline €/L | 0,58 | –1,4 | 3,8 | –10,1 |
| Gas Oil | 701,1 | 0,6 | 5,8 | –9,8 |
| Heavy fuel | 458,3 | –0,9 | –0,9 | –17,8 |
| Naphtha | 682,0 | 1,7 | 6,7 | –9,4 |
- Prices are in euros per tonne unless otherwise specified
- Source : INSEE
tableautabmatprem – Imported raw materials (excluding energy) in euros
| Index | Changes (%) | |||
|---|---|---|---|---|
| over the last month | over the last 3 months | over the last 12 months | ||
| Food total | 178,0 | –6,8 | –6,8 | –19,3 |
| Tropical foodstuff | 143,0 | 0,8 | –3,8 | –17,9 |
| Oil seeds, vegetable oils | 232,0 | –12,5 | –6,5 | –23,0 |
| Cereals | 169,4 | –12,1 | –18,2 | –29,2 |
| Sugar | 140,4 | 0,2 | –4,6 | –24,2 |
| Beef meat | 116,6 | –2,1 | –6,3 | –4,8 |
| Industrial raw materials | 161,6 | 2,1 | –2,0 | –6,1 |
| Agricultural raw materials | 102,8 | 0,4 | –3,3 | –5,0 |
| Natural fibres | 129,7 | –1,8 | –3,4 | 0,7 |
| Natural rubber | 252,1 | 4,7 | –8,0 | –15,4 |
| Hides | 82,3 | –5,6 | –6,7 | 2,6 |
| Wood pulp | 87,4 | –1,9 | –2,0 | –2,2 |
| Tropical wood | 97,0 | 0,3 | –1,1 | –8,1 |
| Sawn softwood | 88,5 | 2,6 | –2,7 | –2,1 |
| Minerals | 193,8 | 2,7 | –1,6 | –6,2 |
| Iron ore | 762,0 | 5,9 | 7,7 | 18,5 |
| Non-ferrous metals | 144,3 | 1,6 | –3,6 | –10,1 |
| Precious metals | 240,4 | 4,7 | –5,6 | –19,9 |
| All commodities | 161,0 | –1,5 | –3,9 | –11,5 |
- Source : INSEE
graphiqueG_petrole_ang – Oil
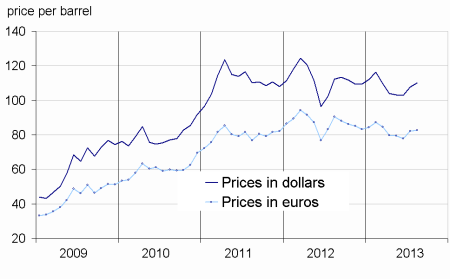
- Source : Insee
graphiqueG_alim_ang – Food
- Source : Insee
graphiqueG_ensemble_ang – All commodities
- Source : Insee
graphiqueG_indus_ang – Industrial raw materials
- Source : Insee
Pour en savoir plus
Time series : Raw materials prices
