


 13 June 2014
2014- n° 136Decrease in business start-ups in May 2014 Enterprise births - May 2014
13 June 2014
2014- n° 136Decrease in business start-ups in May 2014 Enterprise births - May 2014
In May 2014, the number of business start-ups including self-managed enterprises seasonally and working-day adjusted data (sa-wda) slipped compared to April: -1.4% and -0.9% for business start-ups excluding self-managed enterprises.
In May 2014, the number of business start-ups including self-managed enterprises seasonally and working-day adjusted data (sa-wda) slipped compared to April: -1.4% and -0.9% for business start-ups excluding self-managed enterprises.
+1.3% year-on-year (quarterly basis)
The amount of entries added up in the last three months increased compared to the same months one year before (+1.3%) specially for companies (+6.0%).
The sectors that most contributed to that rise were business support activities and wholesale and retail trade, transport, accommodation and food and beverage service activities.
-0.1% year-on-year (twelve months basis
During the last twelve months, the number of business start-ups decreased by 0.1% year-on-year but the number of companies increased (2.4%).
More than one creation out of two is a self-managed enterprise
In May 2014, 50.8% businesses sets up over the last twelve months were self-managed enterprises.
tableautab0 – business set-ups distribution by type %
| March. 2014 | April 2014 | May 2014 | |
|---|---|---|---|
| Companies | 29,7 | 29,8 | 29,9 |
| Individual enterprises | 19,4 | 19,4 | 19,3 |
| Self-managed business | 50,9 | 50,8 | 50,8 |
- Source: INSEE (Sirene)
tableautab1EN – Business set-ups by month
| Feb. 2014 | March 2014 | April 2014 | May 2014 | |
|---|---|---|---|---|
| Excl. self-managed enterprises (sa-wda *) | 22 667 | 22 375 | 23 019 | 22 818 |
| Variation [m-o-m] % | 0.5 | -1.3 | 2.9 | -0.9 |
| Incl., self-managed enterprises | 46 011 | 45 243 | 46 271 | 45 644 |
| Variation [m-o-m] % | -2.1 | -1.7 | 2.3 | -1.4 |
- * Seasonally and working-day adjusted data
- Source: INSEE (Sirene)
tableautab2EN – business start-ups by type
| Moving total % change* | Moving total | Moving total | ||
|---|---|---|---|---|
| over 3 months | over 12 months | January- May 2014 | January- May 2013 | |
| Total | 1.3 | -0.1 | 242 503 | 238 091 |
| Companies | 6.0 | 2.4 | 72 742 | 69 552 |
| Individual enterprises | -0.6 | -1.1 | 169 761 | 168 539 |
| Of which self-managed | -0.4 | -5.9 | 122 688 | 121 934 |
- * Total of business start-ups during the last 3 or 12 months compared with the same months a year earlier
- // = meaningless
- Source: INSEE (Sirene)
graphiqueGraph1EN – Business start-ups
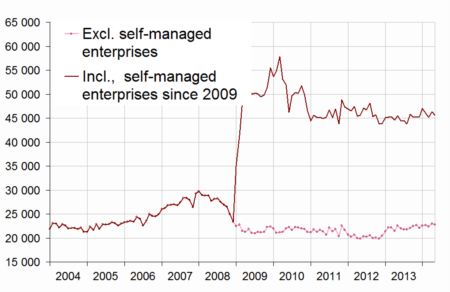
- * Seasonally and working-day adjusted data
- Source: INSEE (Sirene)
Pour en savoir plus
Time series : Business demography
