


 28 February 2014
2014- n° 49Stability in producer prices of services sold to French businesses or on foreign markets,
decline in producer prices of services sold to households Services producer price indices - 4th quarter 2013
28 February 2014
2014- n° 49Stability in producer prices of services sold to French businesses or on foreign markets,
decline in producer prices of services sold to households Services producer price indices - 4th quarter 2013
In the fourth quarter of 2013, services producer prices sold to French businesses remained stable overall (+0.1% following +0.0% in the last quarter).
- SPPI, production sold to French businesses
- Prices for most services sold to businesses were on the rise…
- …while prices for real estate services (–0.5%) and for transportation and storage services (–0.4%) moved down.
- SPPI, production sold to households in France
- SPPI, production sold on foreign markets
- SPPI (all markets)
SPPI, production sold to French businesses
In the fourth quarter of 2013, services producer prices sold to French businesses remained stable overall (+0.1% following +0.0% in the last quarter).
Prices for most services sold to businesses were on the rise…
Prices for information and communication services rallied (+0.9% following –0.4%). In particular, prices for programming and broadcasting services rebounded (+11.9% following –11.9%); driven up by the seasonal rise in prices for advertising spaces.
Prices for administrative and support services moved up as in the third quarter (+0.3%, following +0.3%). Prices for employment activities rose strongly (+1.2%, following +0.2%), mainly those for temporary employment agencies services (+1.3%, following +0.3%).
Prices for professional, scientific and technical services increased slightly (+0.2%, following –0.5%). Advertising prices advanced (+2.8% following –3.0%) due to a seasonal effect, while prices for management consulting services dipped (–0.4%, following +0.1%).
…while prices for real estate services (–0.5%) and for transportation and storage services (–0.4%) moved down.
Prices for real estate services dropped again (–0.5% following –0.1%): prices for real estate services on a fee or contract basis increased (+1.5%, following –0.6%) but this rise was more than offset by the fall of non–residential rents (–0.8%, following –0.1%).
Prices for freight transport services decreased (–0.4%, following +0.3%). Prices for freight air transport services declined significantly (–2.6%, following 0.0%), while prices for freight road transport services were still unchanged (0.0%, following 0.0%).
SPPI, production sold to households in France
Services producer price sold to households in France fell significantly in the fourth quarter of 2013 (–1.5% following +2.1%), mostly due to the seasonal decline in prices for accomodation and food services (–3.2% following +3.5%) ; prices for administrative and support services also moved down (–3.1% following +2.6%), particularly for rental and leasing services (–2.9% following +1.7%)
SPPI, production sold on foreign markets
Services producer prices sold on foreign markets were unchanged in the fourth quarter of 2013 (+0.0%, following +1.9%). However the international prices for sea freight water transport services rose significantly (+12.6%).
SPPI (all markets)
On all markets, services producer prices fell slighlty (–0.3% following +0.6%). Year-over-year they were almost unchanged (+0.1%).
graphiqueGraphique1 – Producer price indices for all services
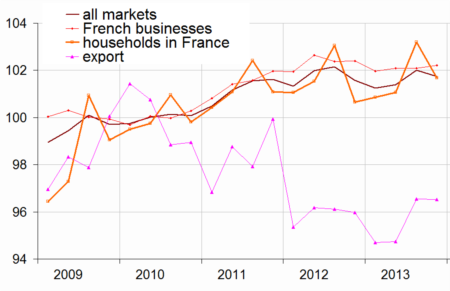
- Source : Insee
graphiqueGraphique2 – Producer price indices of services sold to French businesses
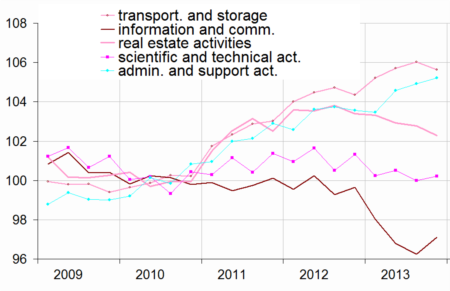
- Source : Insee
graphiqueGraphique3 – Services producer price indices, all markets
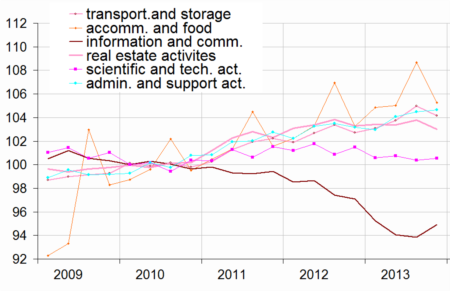
- Source : Insee
tableauTableau1 – Services producer price indices, by sectors:
| Sections and choices of | Weight | Indices | Change in % | |
|---|---|---|---|---|
| levels in NAF rev.2 | 2013T04 | Q/Q-1 | Q/Q-4 | |
| Prices of services sold to French businesses (BtoB) | ||||
| HN : all services | 1000 | 102.2 | 0.1 | –0.2 |
| H : transport. and storage | 187 | 105.6 | –0.4 | 1.2 |
| 49.41 : freight trans. by road | 65 | 105.8 | 0.0 | 0.8 |
| J : information and comm. | 222 | 97.1 | 0.9 | –2.6 |
| 62 : IT services | 87 | 101.4 | 0.5 | 0.0 |
| L : real estate activities | 100 | 102.3 | –0.5 | –1.1 |
| M : prof., scient. and tech. | 200 | 100.2 | 0.2 | –1.1 |
| 69 : legal and accounting | 38 | 103.8 | –0.3 | 1.0 |
| 70.2 : management consult. | 43 | 102.6 | –0.4 | 1.3 |
| 71.12 : engineering | 64 | 98.1 | 0.0 | –3.2 |
| 73.1 : advertising | 26 | 97.5 | 2.8 | –3.2 |
| N : administ. and support | 260 | 105.2 | 0.3 | 1.6 |
| 77.1 : renting of motor veh. | 17 | 102.2 | –0.4 | –1.4 |
| 77.3 : renting of mach. | 30 | 102.5 | 0.5 | 0.0 |
| 78 : employment activities | 50 | 108.8 | 1.2 | 3.1 |
| 81 : services to buildings and landscape activities | 28 | 104.9 | 0.2 | 1.3 |
| S95 : repair of computers and person. and household goods | 9 | 107.0 | –0.1 | –0.4 |
| Prices of services sold to households in France (BtoC) | ||||
| HN : all services | 1000 | 101.7 | –1.5 | 1.0 |
| H : transport. and storage | 168 | 104.4 | –2.0 | 1.6 |
| I : accomodation and food | 337 | 105.3 | –3.2 | 2.0 |
| J : information and comm. | 186 | 89.5 | 2.3 | –7.8 |
| L : real estate activities | 177 | 104.1 | –1.2 | 0.8 |
| M : prof., scient. and tech. | 71 | 103.3 | 0.0 | 1.8 |
| N : administ. and support | 43 | 99.7 | –3.1 | –3.3 |
| S95 : repair of computers and person. and household goods | 18 | 107.9 | 0.1 | 0.6 |
| Export prices of services (BtoE) | ||||
| HN : all services | 1000 | 96.5 | 0.0 | 0.6 |
| H : transport. and storage | 473 | 96.8 | –0.7 | 2.8 |
| 49.41 : freight transp. by road | 64 | 108.4 | 0.4 | 3.0 |
| 50.20 : sea and coast. freight | 142 | 70.7 | 12.6 | 9.9 |
| 50.40 : inland freight water | 1 | 110.9 | –2.1 | –3.5 |
| 51.21 : freight air transport | 21 | 133.8 | 1.6 | 8.1 |
| 53 : postal and courier serv. | 13 | 110.8 | 0.0 | 3.1 |
| JB : telecommunications | 51 | 60.1 | 2.8 | –13.4 |
| 70.22 : busin. & mgt consult. | 46 | 97.9 | –0.1 | –3.3 |
| 71.12 : engin. & tech. consult. | 66 | 101.8 | 0.0 | –0.4 |
| Prices of services sold on all markets (BtoAll) | ||||
| HN : all services | 1000 | 101.7 | –0.3 | 0.1 |
| H : transport. and storage | 200 | 104.2 | –0.8 | 1.4 |
| I : accomodation and food | 98 | 105.2 | –3.1 | 1.9 |
| J : information and comm. | 208 | 94.9 | 1.2 | –2.2 |
| L : real estate activities | 113 | 103.0 | –0.8 | –0.3 |
| M : prof., scient. and tech. | 167 | 100.5 | 0.2 | –0.9 |
| N : administ. and support | 204 | 104.6 | 0.2 | 1.4 |
| S95 : repair of computers and person. and household goods | 11 | 107.4 | 0.0 | 0.1 |
- Source : INSEE
tableauTableau3 – Measure of revision for each indicator at the HN 'all services' level
| Services producer price indices | 2013Q03 / 2013Q02 |
|---|---|
| - services sold to all markets | // |
| - services sold to French businesses | // |
| - services sold to consumers in France | // |
| - export of services | // |
- (1) Reading note : the development of indices between the second and third quarters 2013 published at the end of November 2013 remained the same after the calculations of February 2014.
Documentation
Simplified methodology (pdf,134 Ko)
Pour en savoir plus
Time series : Services producer price indices
