


 27 February 2014
2014- n° 46In the fourth quarter 2013, prices of second-hand dwellings kept on decreasing year-on-year
(-1.4 %) Indexes of prices of second-hand dwellings - 4th Quarter 2013
27 February 2014
2014- n° 46In the fourth quarter 2013, prices of second-hand dwellings kept on decreasing year-on-year
(-1.4 %) Indexes of prices of second-hand dwellings - 4th Quarter 2013
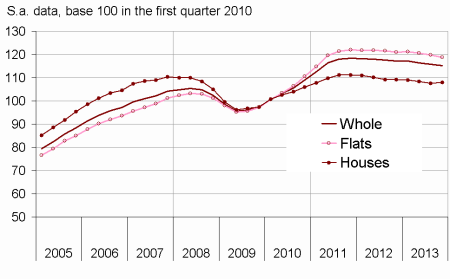
After having slipped during two years, prices of second-hand dwellings seemed to level off in the fourth quarter 2013 according to provisional results (+0.3%, s.a. data, of which +0.6% for houses and -0.2% for flats). Year-on-year, prices decreased : -1.4%, including -1.4% for flats as for houses.

Notice : improvement in electronic collect system of data in provincial France led to a revision of the changes concerning the second and the third quarter 2013. The effect of this improvement is transitory and should diminish rapidly.
After having slipped during two years, prices of second-hand dwellings seemed to level off in the fourth quarter 2013 according to provisional results (+0.3%, s.a. data, of which +0.6% for houses and -0.2% for flats).
Year-on-year, prices decreased : -1.4%, including -1.4% for flats as for houses.
In Île-de-France prices kept on going down in the fourth quarter 2013
In Île-de-France, in the fourth quarter 2013, prices of second-hand dwellings dropped by 0.4 % (provisional results, s.a. data). This decline recovers different changes : prices of flats fall by 0.8 % whereas prices of houses went up by 0.3 %.
Year-on-year, prices in Île-de-France went down (–1.7 %). Prices of flats decreased by 1.9 % and prices of houses by 1.2 %.
In provincial France, the fall of prices year-on-year was less dramatic in the fourth quarter 2013
In provincial France, prices rose by 0.6 % (s.a. data) in the fourth quarter 2013 : +0.7 % for houses and +0.4 % for flats.
Year-on-year, prices of second-hand dwellings in provincial France went down : -1.3 % (-1.0 % for flats and -1.5 % for houses).
graphiqueGraphique1a – Prices of second-hand dwellings
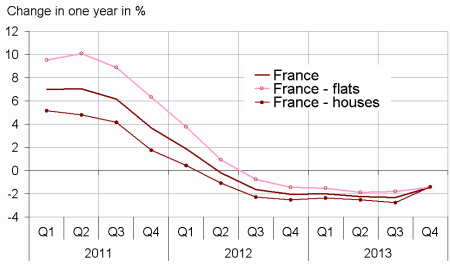
- Insee, French notaries - Database Bien, Perval society
graphiqueGraphique2a – Prices of second-hand dwellings in Île-de-France
- Insee, French notaries - Database Bien, Perval society
tableauTableau1a – Prices of second-hand dwellings indexes
| change in | ||||||
|---|---|---|---|---|---|---|
| 3 months (S.A.) | 12 months | |||||
| 2013 Q2 | 2013 Q3 (sd) | 2013 Q4 (p) | 2013 Q2 | 2013 Q3 (sd) | 2013 Q4 (p) | |
| France | –0.7 | –0.7 | 0.3 | –2.2 | –2.3 | –1.4 |
| Flats | –0.6 | –0.3 | –0.2 | –1.9 | –1.8 | –1.4 |
| Houses | –0.7 | –1.1 | 0.6 | –2.5 | –2.8 | –1.4 |
- (p) : provisional
- (sd) : semi-definitive
- Sources : Insee, French notaries - Database Bien, Perval society
The annual volume of transactions kept on increasing in the fourth quarter 2013
In december 2013, the rebound of the annual volume which started at the beginning of the year went on. The volume of transactions was estimated at 723 000 over the last 12 months, that represented an rise of 4.9 % compared with the corresponding figure for September 2013.
In 2013, the volume of transactions rose (+2.7 % against the transactions concluded in 2012).
graphiqueGraphique3a – Volume of transactions of second-hand dwellings over the last 12 months
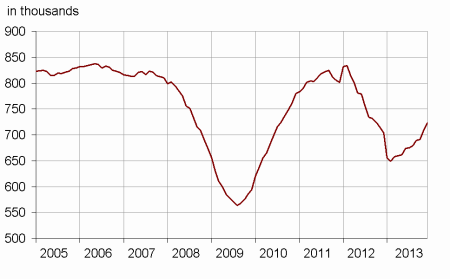
- CGEDD-Meeddm based on notarial databases and DGFiP
Revisions
In comparison to the results released on 7th January, the change in prices was revised by -0.4 point in the second quarter 2013 and by -0.3 point in the third quarter 2013.
In Île-de-France, the change in prices was revised by -0.4 point in the third quarter 2013. Concerning provincial France, the change in prices was revised by -0.6 point in the second quarter 2013 and by -0.3 point in the third quarter 2013.
tableau – Change in prices of second-hand dwellings in France
| Change in | ||||||
|---|---|---|---|---|---|---|
| 3 months (S.A.) | 12 months | |||||
| 2013 Q2 | 2013 Q3 (sd) | 2013 Q4 (p) | 2013 Q2 | 2013 Q3 (sd) | 2013 Q4 (p) | |
| France métropolitaine | –0.7 | –0.7 | 0.3 | –2.2 | –2.3 | –1.4 |
| - Flats | –0.6 | –0.3 | –0.2 | –1.9 | –1.8 | –1.4 |
| - Houses | –0.7 | –1.1 | 0.6 | –2.5 | –2.8 | –1.4 |
| Île-de-France | –0.6 | –0.7 | –0.4 | –1.2 | –1.6 | –1.7 |
| Province | –0.8 | –0.7 | 0.6 | –2.7 | –2.7 | –1.3 |
| Flats | ||||||
| Île-de-France | –0.6 | –0.7 | –0.8 | –0.9 | –1.6 | –1.9 |
| - Paris | –1.3 | –0.4 | –0.4 | –1.7 | –2.0 | –1.5 |
| - Seine-et-Marne | 0.3 | 0.6 | –1.3 | –1.1 | –0.3 | –1.7 |
| - Yvelines | –0.6 | –0.5 | –1.5 | –1.0 | –1.3 | –3.2 |
| - Essonne | 0.5 | –0.2 | –1.6 | –0.6 | –0.9 | –2.6 |
| - Hauts-de-Seine | –0.1 | –1.2 | –0.9 | –0.2 | –1.6 | –2.0 |
| - Seine-Saint-Denis | 0.8 | –1.4 | –0.9 | 0.2 | –1.4 | –1.9 |
| - Val-de-Marne | 0.4 | –1.4 | –0.5 | 0.1 | –1.4 | –1.6 |
| - Val-d'Oise | 0.3 | –0.3 | –1.5 | –0.5 | –0.9 | –2.3 |
| Province | –0.7 | 0.2 | 0.4 | –2.8 | –2.0 | –1.0 |
| - Agglomérations > 10 000 hab | –0.8 | 0.2 | ** | –2.8 | –2.0 | ** |
| - Villes-centres | –0.7 | 0.2 | ** | –2.6 | –2.0 | ** |
| - Banlieues | –1.0 | 0.2 | ** | –3.3 | –1.8 | ** |
| - Agglomérations < 10 000 hab | 0.0 | –0.3 | ** | –2.5 | –1.9 | ** |
| Houses | ||||||
| Île-de-France | –0.5 | –0.7 | 0.3 | –1.7 | –1.5 | –1.2 |
| - Seine-et-Marne | –0.7 | –0.2 | 0.2 | –2.1 | –1.7 | –1.5 |
| - Yvelines | –0.6 | –0.7 | 0.9 | –1.8 | –1.8 | –0.6 |
| - Essonne | –0.6 | –0.4 | 0.3 | –2.5 | –1.9 | –1.3 |
| - Hauts-de-Seine | –0.3 | –0.9 | 0.2 | 0.4 | –0.6 | –0.5 |
| - Seine-Saint-Denis | –0.2 | –1.5 | –0.6 | –1.9 | –1.5 | –2.5 |
| - Val-de-Marne | –0.4 | –1.0 | 0.1 | –1.4 | –1.2 | –1.5 |
| - Val-d'Oise | –0.6 | –0.5 | 0.0 | –1.6 | –1.0 | –1.3 |
| Province | –0.8 | –1.1 | 0.7 | –2.7 | –3.0 | –1.5 |
| Nord-Pas de Calais | –1.1 | 0.0 | ** | –2.0 | –1.7 | ** |
| - Flats | –1.6 | –0.7 | ** | –3.4 | –3.5 | ** |
| - Houses | –1.0 | 0.1 | ** | –1.8 | –1.3 | ** |
| - Lille Houses | –0.6 | 0.2 | ** | –0.8 | –0.5 | ** |
| Provence-Alpes-Côte d'Azur | –0.1 | –1.4 | ** | –2.8 | –3.2 | ** |
| - Flats | –1.8 | 0.6 | ** | –4.4 | –3.1 | ** |
| - Houses | 2.0 | –3.6 | ** | –0.9 | –3.3 | ** |
| - Marseille Flats | –4.3 | 1.7 | ** | –5.4 | –3.4 | ** |
| Rhône-Alpes | –1.0 | –0.1 | ** | –1.9 | –1.0 | ** |
| - Flats | 0.3 | –0.4 | ** | –0.9 | –0.5 | ** |
| - Houses | –2.3 | 0.2 | ** | –2.9 | –1.6 | ** |
| - Lyon Flats | 1.5 | –2.0 | ** | 2.3 | –0.1 | ** |
- ** indice released on the 7th April 2014
- (p) : provisional
- (sd) : semi-definitive
- Sources : Insee, French notaries - Database Bien, Perval society
Pour en savoir plus
