


 14 January 2014
2014- n° 8The Consumer Prices Index increased by 0.3% in December 2013; it rose by 0.7%, year-on-year Consumer price index - final results - December 2013
14 January 2014
2014- n° 8The Consumer Prices Index increased by 0.3% in December 2013; it rose by 0.7%, year-on-year Consumer price index - final results - December 2013
Monthly change: +0.3%; Year-on-year: +0.7% The Consumer Prices Index increased by 0.3% in December 2013, after a stability in November 2013. Seasonally adjusted, it went up by 0.1% in December 2013 and by 0.7% year-on-year as in November 2013. Excluding tobacco, the CPI increased by 0.4% between November and December 2013 and increased by 0.6% in December 2013 compared with the same month one year ago. The largest upward pressures on the change in the CPI of December 2013 came mainly from seasonally price increases of some services and manufactured products and from a rebound in prices of petroleum product and fresh foodstuffs.
Here are published the monthly and annual rates (year-on-year) of change of the Consumer Prices Index (CPI) in December 2013. The annual average rates of change of the CPI will also be published on 14th January. The annual averages and the year-on-year rates of change are different: the annual averages refer to the whole set of prices observed during one year compared to those observed during the previous year. The year-on-year price changes refer to the prices observed during a particular month compared to those observed during the same month of the previous year.
Monthly change: +0.3%; Year-on-year: +0.7%
The Consumer Prices Index increased by 0.3% in December 2013, after a stability in November 2013. Seasonally adjusted, it went up by 0.1% in December 2013 and by 0.7% year-on-year as in November 2013. Excluding tobacco, the CPI increased by 0.4% between November and December 2013 and increased by 0.6% in December 2013 compared with the same month one year ago. The largest upward pressures on the change in the CPI of December 2013 came mainly from seasonally price increases of some services and manufactured products and from a rebound in prices of petroleum product and fresh foodstuffs.
Seasonal increase in services prices
The service prices increased overall by 0.5% in December 2013 (+1.4% compared with the same month one year ago). This increase, lower than last year in December (+0.7%), came mainly from some services linked with the holidays at the year ending. Thus, the airfares jumped in December 2013 by 13.8% (—2.2% year-on-year), those of package holidays by 12.7% (—3.0% year-on-year) and those of accomodation services by 13,0%. As usual in December, the refuse collection fees increased in December (+2.3% in 2013 ; +2.8% in 2012). Besides, insurance fees increased seasonally in December (+1.7%; +1.3% compared with the same month one year ago) after promotion endings.
tableauOLE_LINK2 – Detailed figures for various groups
| Items | Weight 2013 | Index Dec. 2013 | Month rate (%) | Annual rate (%) |
|---|---|---|---|---|
| a) All households - France | ||||
| All items (00 E) | 10000 | 127.64 | 0.3 | 0.7 |
| All items SA (00 C) | 10000 | 127.62 | 0.1 | 0.7 |
| Food (4000 E) | 1658 | 132.25 | 0.1 | 0.4 |
| Fresh food (4001 E) | 210 | 140.72 | 1.5 | 0.4 |
| Food excluding fresh products (4002 E) | 1448 | 131.05 | –0.1 | 0.4 |
| Tobacco (4034 E) | 206 | 249.81 | 0.0 | 3.5 |
| MANUFACTURED PRODUCTS (4003 E) | 2738 | 101.60 | 0.1 | –0.6 |
| Clothing and footwear (4004 E) | 458 | 112.24 | 0.6 | 0.7 |
| Medical products (4005 E) | 455 | 80.06 | –0.1 | –3.1 |
| Other manufactured products (4006 E) | 1825 | 104.46 | 0.0 | –0.3 |
| ENERGY (4007 E) | 822 | 178.40 | 0.7 | 1.0 |
| Petroleum products (4008 E) | 495 | 204.04 | 1.3 | –1.8 |
| SERVICES (4009 E) | 4576 | 134.41 | 0.5 | 1.4 |
| Actual rentals and services for dwellings (4010 E) | 748 | 141.04 | 0.2 | 1.4 |
| Medical services (4011 E) | 542 | 122.13 | 0.1 | 0.3 |
| Transport and communication services (4012 E) | 506 | 97.39 | 2.3 | –0.2 |
| Other services (4013 E) | 2780 | 143.87 | 0.4 | 1.9 |
| ALL ITEMS EXCLUDING RENTALS AND TOBACCO (5000 E) | 9202 | 125.21 | 0.4 | 0.6 |
| ALL ITEMS EXCLUDING TOBACCO (4018 E) | 9794 | 125.82 | 0.4 | 0.6 |
| b) Manual or clerical worker headed urban households - France | ||||
| ALL ITEMS EXCLUDING TOBACCO (4018 D) | 9704 | 125.62 | 0.4 | 0.6 |
| ALL ITEMS (00 D) | 10000 | 128.29 | 0.3 | 0.7 |
| c) Households that belong to the lowest equivalized disposable income quintile - France | ||||
| ALL ITEMS EXCLUDING TOBACCO (4018 Q) | 9674 | 127.01 | 0.4 | 0.6 |
- Source : Insee - Consumer Price Indexes
tableauTableau1English – Detailed figures for Core inflation* and HICP**
| Percentage change | ||||
|---|---|---|---|---|
| Items | Weight 2013 | Index Dec. 2013 | Month rate | Month rate |
| All items "Core inflation" (4022 S) | 6085 | 122.53 | 0.0 | 0.6 |
| Food excluding fresh products, meat, milk and exotic products (4019 S) | 715 | 125.68 | –0.1 | –0.3 |
| Manufactured products (4020 S) | 2217 | 105.57 | –0.2 | –0.1 |
| Services including actual rentals and services for dwellings (4021 S) | 3153 | 138.57 | 0.2 | 1.4 |
| All items HICP (00 H) | 115.37 | 0.4 | 0.8 | |
- * ISJ : Core inflation indicator excludes public sector prices, the most volatile consumer prices and the tax measures. Seasonally adjusted, this index is calculated for all households in France excluding overseas departments and territories (base 100 1998).
- **HICP : Harmonised Indices of Consumer Prices are inflation figures required under the Treaty on the functioning of the European Union. They are designed for international comparison of consumer price inflation between Member states of the Union. This index is calculated for all households in France (base 100 2005).
- Source : Insee - Consumer Price Indexes
graphiqueGraphique1English – Consumer price index (IPC) and Core inflation (ISJ) – year-on-year changes
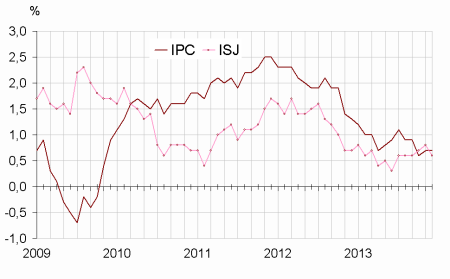
- Source : Insee - Consumer Price Indexes
The prices of petroleum products rebounded
In December 2013, energy prices rebounded (+0.7% after —0.6% in November 2013; +1.0% year-on-year), due to a growth in prices of petroleum products (+1,3%; —1,8% year-on-year), slightly higher for heating fuels (+1.5%; —3.5% year-on-year) than for motor fuels (+1.3%; —1,6% year-on-year). In December 2013, the city gas prices went down by 0.1% (+1.3% year–on–year) while those of electricity were unchanged (+7.5% year-on-year).
Slight increase in food prices
In December 2013, the food prices rose by 0.1%, as in November 2013. Compared with the same month one year ago, they grew by 0.4% in December 2013 (after +0.3%, year on year in November 2013). This increase came only from a rebound in the prices of fresh foodstuffs (+1.5% in December 2013; +0,4% year-on-year), especially from fresh vegetables (+4.9% in December as in November 2013; +1.6% year-on-year), due to a weak supply at the end of 2013. With the seasonal increase in prices of the fresh fish and seafood (+1.3% in December 2013; +3.4% compared with the same month one year ago), these increases have more than offset the seasonal decrease in fresh fruit prices in December 2013 (—1.7%; —1.9% year-on-year). Excluding fresh foodstuffs, the food prices declined slightly in December 2013 (—0.1%) and pursued their slowdown. Thus, their annual rate of change stood at 0.4% in December 2013 down from +0.5% in November 2013 and +0.6% in October 2013.
Increase in the prices of manufactured products
Overall, the prices of manufactured goods increased slightly in December 2013 (+0.1%; —0.6% year-on-year after —0.5% in November 2013), due to a seasonal growth in the clothing and footwear prices (+0.6% between November and December 2013; +0.7% between November and December 2012). Excluding medical product which prices continued to decline in December 2013 (—0.1%; —3.1% year-on-year), the prices of the other manufactured products remained stable in December 2013 (0%; —0.3% year-on-year). In addition to the downward tendencies in the prices of the audio-visual, photographic and information processing equipments (—0.9% in December 2013; —7.3% year-on-year), promotions took place for some products in December 2013. It was the case for the games and toys (—0,8%), the jewels, clocks and watches (—0.3%), the furniture and furnishing (—0.2%) and the beauty products (—0.1%).
The core inflation indicator decreased slightly
In December 2013, the core inflation indicator (ISJ) remained almost stable compared with November 2013. Its annual rate of change diminished (+0.6%, after +0.8% in November 2013). The Harmonised Index of Consumer Prices (HICP) grew by 0.4% in December 2013 and by 0.8% compared with the same month one year ago (as in November 2013).
Pour en savoir plus
