


 6 May 2014
2014- n° 107In 2014, investment in the manufacturing industry will increase by 4 %, according
to business managers Industrial investment survey - April 2014
6 May 2014
2014- n° 107In 2014, investment in the manufacturing industry will increase by 4 %, according
to business managers Industrial investment survey - April 2014
Surveyed in April 2014, business managers estimated that investment in manufacturing industry decreased by 7% in 2013, in line with their previous expectations given last January.
Surveyed in April 2014, business managers estimated that investment in manufacturing industry decreased by 7% in 2013, in line with their previous expectations given last January.
graphiqueGraph1_ang – Annual nominal change in investment in manufacturing industry
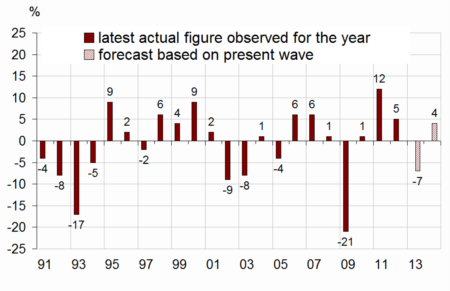
For 2014, business managers look forward to an improvement in investment
For 2014, business managers in the manufacturing industry forecast that their investment will increase by 4% compared to 2013. Their revised 1 point upwards their previous expectations given in January. This revision upwards concerns all sectors except the sector of motor vehicles (–1 point). After a decrease in investment in 2013 in all sectors, business leaders forecast a rebound in 2014: +9% in the manufacture of food products and beverages, +8% in the sector of electrical and electronic and machine equipment and +3% in the sector of other manufacturing. By contrast, the investment in the sector of the manufacture of transport equipment will go down, but this decrease will lessen (–3% after –13%).
| NA* : (A17) and [A38] | 2013 | 2014 | ||
|---|---|---|---|---|
| estimate Jan.14 | observed Apr.14 | estimate Jan.14 | estimate Apr.14 | |
| MANUFACTURING INDUSTRY | –7 | –7 | 3 | 4 |
| (C1): Manufacture of food products and beverages | –2 | 0 | 7 | 9 |
| (C3): Electrical and electronic equipment; machine equipment | –7 | –7 | 7 | 8 |
| (C4): Manufacture of transport equipment | –12 | –13 | –4 | –3 |
| [CL1]: Motor vehicles | –22 | –21 | –2 | –3 |
| (C5): Other manufacturing | –8 | –6 | 2 | 3 |
| Total sectors C3-C4-C5 | –9 | –8 | 2 | 3 |
- How to read this table : In manufacturing industry, firms surveyed in April 2014 observed a decrease by 7% of their nominal investment in 2013 comparing to 2012 and forecast an increase of 4% in 2014 comparing to 2013.
- * The codes correspond to the level of aggregation (A17) and [A38] of the "NA" aggregate classification based on NAF rev.2.
graphiqueTab1_ang – Annual nominal change in investment in manufacturing industry
Investment leaders anticipate an increase in their investment in H2 2014
Between H2 2013 and H1 2014, industrial leaders state the stabilisation of their investment. From now on, between H1 and H2 2014, business managers anticipate a sharp increase in their investment.
graphiqueGraph2_ang – Six-month change in investment (first estimation*)
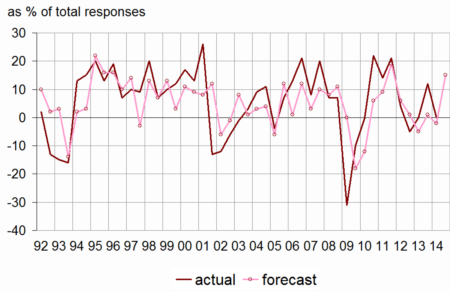
- * See technical note "A new six-month change estimation", Information Rapide Survey of Industrial Investment - July 2010
In 2014, purposes of investment will remain similar to 2013
According to business leaders in manufacturing industry, the share of purposes of investment will slightly change in 2014 comparing to 2013. The proportion of investment purposed to replacement will decrease by 1 point at 28%, a level closed to its long-term average (27%). The share of investment purposed to safety, environment or working conditions will slightly increase (21% after 20%), as the share of investment purposed to modernization will (24% after 22%). On the contrary, industrials will decrease the share of investment purposed to increase in productive capacity (16% after 15%) or purposed to introduction of new products (13% after 12%).
tableauTab2_ang – Share of purposes of investment
| Average | 2013 | 2014 | |
|---|---|---|---|
| 1991-2013 | observed | forecast | |
| Replacement | 27 | 29 | 28 |
| Modernization, streamlining | 24 | 22 | 24 |
| of which : automation | 11 | 7 | 8 |
| of which : new production methods | 7 | 6 | 7 |
| of which : energy savings | 6 | 9 | 9 |
| increase in productive capacity | 16 | 16 | 15 |
| Introduction of new products | 14 | 13 | 12 |
| Other purposes (safety, environment, working conditions…) | 20 | 20 | 21 |
For 2014, the share of entreprises who will do equipment scrapping will remain stable at 65%, standing below its long-term average. The rate of equipment scrapping for wear and tear, and obsolescence will decrease by 5 points at 51%, but will remain above its long-term average. On the contrary, the share of equipment scrapping due to shut-down of capacity for old products will increase by 2 points at its average (12%). The share of equipment scrapping due to installation of more efficient equipment will rise by 3 points.
tableauTab3a_ang – Productive capacity and equipment scrapping
| Observed | Forecast | |||
|---|---|---|---|---|
| aver. | in 2013 | aver. | for 2014 | |
| Change in productive capacity* | 30 | 19 | 32 | 19 |
| Change in equipment scrapping* | 19 | 18 | –3 | –4 |
| Share of enterprises reporting equipment scrapping* | 76 | 65 | 75 | 65 |
| Breakdown of enterprises reporting equipment scrapping** | ||||
| Wear and tear, obsolescence | 51 | 56 | 48 | 51 |
| Installation of more efficient equipment | 31 | 32 | 34 | 35 |
| Shut-down of capacity for old products | 12 | 10 | 12 | 12 |
| Other scrapping | 5 | 2 | 6 | 2 |
| Total | 100 | 100 | 100 | 100 |
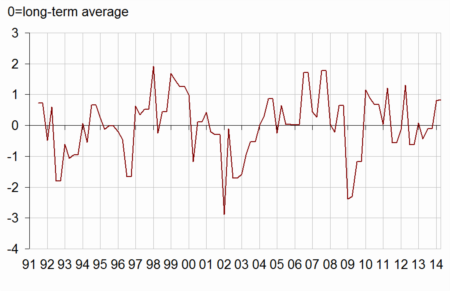
The investment revision indicator stays positive
The investment revision indicator climbs and is close to 1, its standard deviation. Based on investment amounts reported in at each survey by business leaders of the manufacturing industry except those of manufacture of food products and beverages (C1) and of coke and refined petroleum products (C2), this indicator is well-correlated with quarterly growth fixed capital formation of non-financial enterprises. That suggests a rise of investment of these enterprises during 2014.
graphiqueGraphIR_ang – Investment revision indicator *
Documentation
Methodology (pdf,34 Ko)
Pour en savoir plus
Time series : Industry – Investment
